AI Coding Agent Observability: An Enterprise Guide
AI coding agent observability, explained for enterprise leaders: the signals to capture across session, delivery, and runtime — standards, tools, rollout.
 By Danilo Brizola
AI coding agent observability is the practice of capturing what your coding agents did, what it cost, and whether the code they shipped actually behaves — as structured telemetry you can query, alert on, and show an auditor. It is a different problem from the observability stack you already run: an agent can loop, misread a requirement, or merge a defect while every dashboard stays green, because nothing errored. This guide gives CIOs, CTOs, and platform leaders a working signal map across three altitudes — session, delivery, and runtime — plus the emerging OpenTelemetry standards, what major agent platforms already expose natively, and a six-step rollout you can run this quarter.
What AI coding agent observability actually covers
The one-line definition: telemetry that answers, for every agent-driven change, what was attempted, what was done, what it cost, and what happened after it shipped. That is broader than two adjacent terms it gets confused with:
- LLM observability watches individual model calls — prompts, completions, token counts, latency per request. Necessary, but a coding agent is not one model call; it is a session of dozens or hundreds of steps: planning, file edits, shell commands, test runs, retries, sub-agent handoffs. The failure you care about usually lives in the sequence, not in any single call.
- Traditional APM watches services: uptime, error rates, request latency. Coding agents pass every one of those checks while doing the wrong thing, because their primary failure mode is plausible output that is incorrect — which returns a 200.
Coding agents also sit in an unusual position: they are both a workload you run (sessions that consume budget and need tracing) and an author whose output lands in your production systems (code that needs provenance and post-deploy verification). A program that only watches the first half is doing LLM observability with extra steps; a complete one covers three altitudes, which the rest of this guide walks through.
This is not an optional nicety of an agentic engineering operating model — it is one of its load-bearing walls. When agents work as delegated executors rather than autocomplete, the volume of machine-authored change rises by an order of magnitude, and every downstream control — review, governance, incident response, ROI measurement — depends on being able to see what the fleet is doing.
Why coding agents break the monitoring you already have
Four properties of coding agents defeat conventional monitoring assumptions:
- Non-determinism. The same task can produce different plans, different tool sequences, and different code on different runs. You cannot write a static assertion for behavior that legitimately varies; you need traces that show which path was taken and evaluations that score whether the outcome was acceptable.
- Success-shaped failures. An agent that misunderstands a requirement completes its session "successfully." The PR looks clean, CI passes, review approves it — and the defect surfaces weeks later under real traffic. No exception was ever thrown, so nothing built on error signals fires.
- Silent resource burn. Agents can loop on a failing test, re-read the same files, or retry a flaky tool for an hour. Without per-session cost and step-count telemetry, the first sign of trouble is the monthly invoice.
- Throughput outruns inspection. A senior engineer directing several parallel agents produces in a day what used to take weeks. DORA's 2025 research continues to find a negative relationship between AI adoption and delivery stability even as throughput rises — more change volume exposes every weak verification link. Manual spot-checking that worked at copilot speed is statistically blind at agent speed.
The organizational reality compounds the technical one: Cycode's 2026 State of Product Security report found 97% of organizations using or piloting AI coding assistants while 81% lack visibility into how and where AI is used across their SDLC. Most enterprises scaled generation first and are now retrofitting the ability to see it.
The signal map: three altitudes, one program
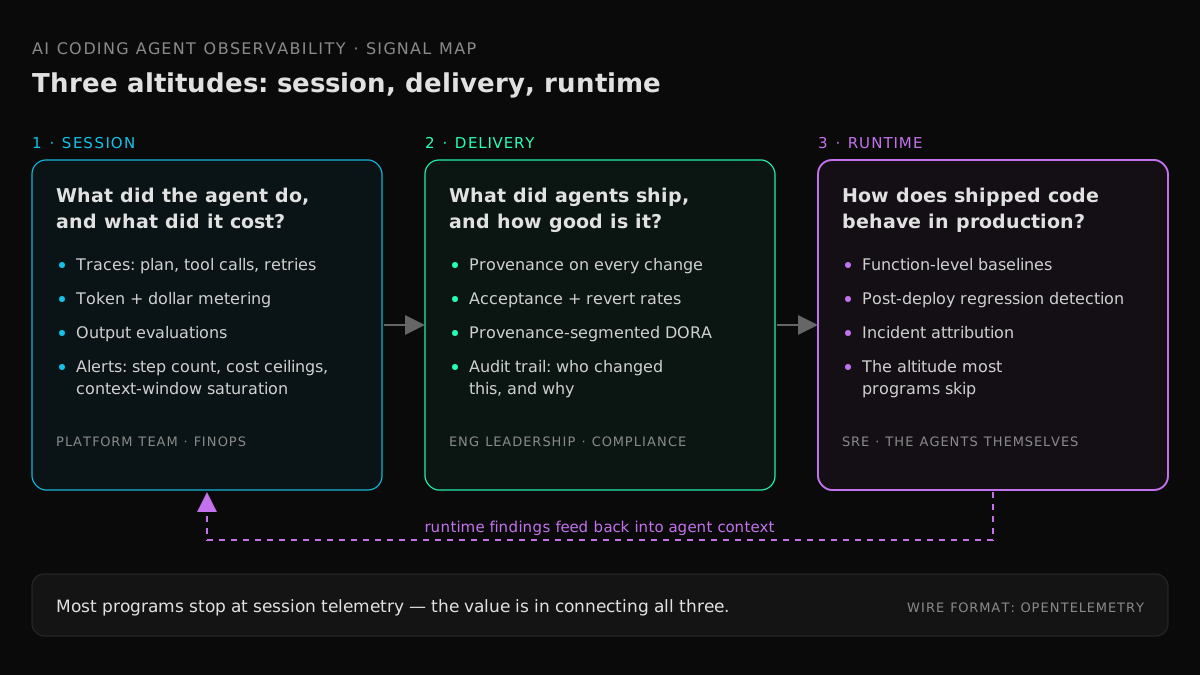
Most vendor content on agent observability covers only the first row of this table. A program that protects an enterprise covers all three.
| Altitude | Question it answers | Core signals | Primary consumers |
|---|---|---|---|
| Session | What did the agent do, and what did it cost? | Traces and spans, token/cost metering, output evaluations | Platform team, FinOps, enablement leads |
| Delivery | What did agents ship, and how good is it? | Provenance labels, acceptance and revert rates, review time, provenance-segmented DORA metrics | Engineering leadership, QA, compliance |
| Runtime | How does agent-authored code behave in production? | Function-level baselines, post-deploy regression detection, incident attribution | SRE, incident response — and the agents themselves |
Session telemetry: traces, cost, and output evaluation
A session trace records the agent's full execution graph: the task it was given, the plan it formed, every tool call (file edits, shell commands, test runs) with arguments and results, every model call with token counts, and any sub-agent handoffs. Traces are what turn "the agent did something weird" into a reproducible investigation — which step went wrong, with what input, after how many retries.
Cost telemetry belongs at the same altitude, metered per session, per user, and per organization, so you can compute the number that actually matters: cost per merged change, not cost per token. Enterprise platforms increasingly expose this natively — Devin's ACU metering by org, user, and session is the clearest example, and we break down how to read it in Devin's enterprise pricing explained.
The third session-level signal family is evaluations: automated scoring of whether the output was acceptable. For coding agents you have an advantage most agent domains lack — much of the output is mechanically verifiable (does it compile, do the tests pass, does the linter object), so lean on hard checks first and reserve LLM-as-judge scoring for softer properties like adherence to architectural conventions.
Practical alert thresholds that catch the common failure modes: tool-call count per session above your fleet's p95, cost per session above a fixed ceiling, error-and-retry rate spikes, and context usage approaching the model's window (a leading indicator of degraded output).
Delivery telemetry: attribution and provenance
The delivery altitude connects sessions to the codebase. Its foundation is provenance: every change labeled agent-generated, agent-assisted, or human-written at commit or PR level. Provenance is what makes every downstream question answerable — differential defect rates, differential revert rates, review time by author type — and it is what an auditor or incident review means by "who changed this and why."
With provenance in place, segment your delivery metrics by it: change failure rate, rework within two weeks, time-to-restore for agent-authored versus human-authored changes. This is the same instrumentation discipline we describe in DORA metrics for AI-assisted software teams, applied with an attribution dimension. If agent-authored changes fail at twice the human rate in one subsystem, that is an actionable finding — tighten the gates there, not everywhere.
Runtime telemetry: the altitude most programs skip
Session observability ends at merge. But the failure modes that hurt most — performance regressions on hot paths, data-shape mismatches, error-handling gaps — are runtime phenomena that no session trace or pre-merge gate reveals, a problem we examine in depth in our guide to production-safe AI-generated code.
Closing this altitude means capturing function-level behavior of shipped code — invocation frequency, latency baselines, error patterns — comparing post-deploy behavior against those baselines, and feeding findings back into agent context so the next generation is grounded in how the system actually behaves. This is the runtime intelligence layer we deploy with Hud's runtime code sensor as an official partner; the integration details are on our Hud runtime intelligence partner page. The point for an observability program is architectural: your telemetry loop should not terminate at the dashboard — it should terminate back in the agent's context.
Standards: OpenTelemetry is becoming the wire format
The risk in buying agent observability in 2026 is lock-in to a telemetry format that the ecosystem abandons. The hedge is OpenTelemetry's GenAI effort: its SIG has drafted an agent application semantic convention (based on Google's AI agent whitepaper) defining how agents report telemetry, with a shared framework convention under discussion and model-level conventions still experimental. The direction is clear even where the details are not final: traces, metrics, and logs for agents are converging on OTel as the vendor-neutral wire format.
The procurement implication: prefer agent platforms that export OTel natively and backends that ingest it without translation. The analysis layer is crowded — Langfuse, LangSmith, Arize Phoenix, and Datadog's LLM Observability all trace agent executions — and OTel compatibility is what keeps that choice reversible. If your organization already runs an observability platform, route agent telemetry into it before standing up a parallel silo: correlation between agent activity and production behavior is the payoff, and it only happens in one place.
What your coding agents already expose
Before buying anything, turn on what you already own. The enterprise platforms ship meaningful telemetry natively:
- Claude Code exports OpenTelemetry metrics and events out of the box: session counts, token usage by type and model, estimated cost, lines of code added and removed, commits and PRs created, and accept/reject decisions on edit tools — plus an event stream covering tool executions, permission decisions, and API errors. Administrators can enforce the configuration through managed settings so individual developers cannot redirect or disable the stream.
- Devin operates as a managed delegation platform, so its telemetry is organizational by design: per-session audit logs, RBAC, and ACU metering by org, user, and session, with usage limits and approval gates layered on top.
- Most other enterprise tiers (Copilot, Cursor) expose at minimum usage analytics and audit logs through admin APIs.
Native telemetry will not cover evaluations or runtime behavior, but it typically answers the first questions leadership asks — who is using agents, on what, at what cost, with what acceptance rate — for the cost of an afternoon of configuration. How this fits the broader platform decision is covered in our guide to AI coding agents for enterprise development.
Observability is how governance gets enforced
A governance policy without telemetry is advice. Every mechanism in a real AI coding governance program depends on an observability signal:
- Autonomy tiers ("agents may do X unsupervised, Y requires review") are enforceable only if provenance labeling tells you which tier each change actually ran under.
- Budgets and quotas require cost metering at the user and org level — otherwise limits are aspirational.
- Accountability — a named human owner for every agent-generated change — requires session traces that connect the change to the directive that produced it.
- Audit and compliance requirements ("show me every change an agent made to the payments service in Q3") are a telemetry query if you built the program, and an archaeology project if you did not.
This is why we treat observability as the enforcement layer when we implement enterprise AI coding governance: policy, pipeline gates, and telemetry designed as one system, so the policy document and the production reality cannot quietly diverge.
Standing it up: a six-step rollout
- Turn on native telemetry and centralize it. Enable what your agent platforms already export, route it through an OTel collector into your existing observability backend. No new vendors yet.
- Label provenance on every change. Agent-generated, agent-assisted, human — at commit or PR level, enforced in CI. This single step unlocks most of the delivery altitude.
- Meter cost to outcomes. Wire session cost to merged changes so you report cost per shipped change, not token burn. Feed it into the ROI model in how to measure ROI from AI in software engineering.
- Add evaluations where output is verifiable. Compile, test, lint, and security gates as hard evals; sampled human or LLM-as-judge review for convention adherence.
- Alert on agent failure modes. Step-count and cost ceilings per session, retry-rate spikes, context-window saturation, and provenance-segmented change-failure-rate shifts.
- Close the runtime loop. Function-level baselines on shipped code, post-deploy comparison, and findings fed back into agent context — the full argument is in the production-safety guide.
Steps 1–3 are a two-week effort for most platform teams; steps 4–6 are a quarter. The order matters: provenance before evals, evals before alerts, because each later step consumes the earlier one's data.
FAQ
What is AI coding agent observability?
It is the telemetry discipline for coding agents: capturing execution traces, token and dollar costs, output quality evaluations, and provenance for every agent session, plus how the code agents ship behaves after deployment. Its purpose is to make agent work auditable, debuggable, and measurable at a throughput where manual inspection fails.
How is agent observability different from LLM observability?
LLM observability traces individual model calls — prompt, completion, tokens, latency. Agent observability traces the full execution graph around those calls: plans, tool invocations, file edits, test runs, retries, and handoffs across a multi-step session, plus the downstream fate of the output. An agent failure usually lives in the sequence, which per-call monitoring cannot see.
How do you monitor AI coding agents in production?
Instrument three altitudes: session traces with cost metering and evaluations while the agent works; provenance-labeled delivery metrics (acceptance, revert, and change-failure rates segmented by author type) when its code merges; and runtime baselines that compare post-deploy behavior of agent-authored code against recorded norms. Alert on step-count and cost anomalies, and on provenance-segmented stability shifts.
What metrics matter most for coding agents?
Cost per merged change, acceptance rate of agent output, provenance-segmented change failure and rework rates, session step counts and retry rates, and time-to-restore when agent-authored changes cause incidents. Token volume alone is the least informative number — it measures spend, not outcomes.
Is OpenTelemetry the standard for AI agent observability?
It is becoming so. OpenTelemetry's GenAI SIG has drafted an agent application semantic convention, with framework-level conventions under discussion and model-level conventions still experimental. It is already the sensible procurement default: prefer platforms that export OTel and backends that ingest it, so your tooling choices stay reversible.
Do we need observability before deploying coding agents, or after?
Baseline telemetry — native platform metrics, provenance labeling, cost metering — belongs in the pilot, because it is how you will know whether the pilot worked. The fuller program (evaluations, runtime baselines) can be built during rollout, but retrofitting provenance after months of unlabeled agent commits permanently blurs your before/after comparison.
How is observability different from evaluation?
Evaluation scores whether a specific output was good; observability records what happened and makes those scores — along with traces, costs, and outcomes — queryable over time. Evals are one signal family inside an observability program, not a substitute for it.
Conclusion: you can't govern what you can't see
Coding agents turn code generation into a high-throughput production system, and production systems get instrumented — that is not a new principle, just a newly urgent application of it. The enterprises compounding returns from agents are the ones that can answer, in one query, what their fleet did, what it cost, what it shipped, and how that code is behaving right now. The ones accumulating risk are the ones that will reconstruct those answers after an incident.
If you are scaling coding agents and want an honest read on your visibility gaps — native telemetry, provenance, cost attribution, evaluations, runtime feedback — take the AI Readiness Assessment. It benchmarks your current instrumentation against the three-altitude model in this guide and returns a prioritized gap list your platform team can act on next quarter.
Find your highest-value path to agentic delivery.
Map your readiness, delivery constraints, and first 90-day opportunity with the Snowman Labs AI Readiness Diagnostic.