How to Measure ROI from AI in Software Engineering
A practical framework for how to measure ROI of AI in software engineering: baselines, DORA metrics, cost per outcome, and a CFO-ready business case.
 By Danilo BrizolaUpdated
 The reliable way to measure ROI of AI in software engineering is a single formula applied against a frozen baseline: ROI = (value of additional delivered outcomes − fully loaded program cost) ÷ fully loaded program cost, where "outcomes" are production changes or roadmap items — never lines of code. In practice, that means capturing 60–90 days of delivery, quality, and cost-per-outcome metrics before rollout, then comparing the same teams against their own baseline once adoption stabilizes.
This guide is for CIOs, CTOs, and VPs of Engineering who need to defend an AI tooling budget — or decide whether to expand one — with numbers a CFO will accept. By the end you will have the formula, the metrics that actually track AI impact, a step-by-step baseline-first methodology, a worked example, and a 90-day measurement plan you can start Monday.
Why proving ROI of AI coding tools is harder than it looks
The published evidence on AI coding productivity is genuinely contradictory, which is exactly why measurement discipline matters more than tool selection. Consider three credible studies that reach three different conclusions:
- GitHub's controlled experiment found developers using Copilot completed a benchmark task 55% faster (1 hour 11 minutes vs. 2 hours 41 minutes), and in a survey of more than 2,000 developers, 88% reported feeling more productive.
- McKinsey's lab study found gains that vary sharply by task: 45–50% time savings on code documentation, 35–45% on code generation, 20–30% on refactoring — and under 10% on high-complexity tasks.
- METR's randomized controlled trial found that experienced open-source developers working in mature codebases were 19% slower with AI tools — while estimating, even afterward, that AI had made them 20% faster. Sixteen developers, 246 real tasks, a 39-percentage-point gap between perception and measurement.
These results are not mutually exclusive. They measure different populations (novices vs. experts), different work (greenfield tasks vs. million-line legacy repositories), and different instruments (stopwatch vs. self-report). The lesson for an engineering executive is uncomfortable but clear: you cannot borrow someone else's ROI number, and you cannot trust self-reported time savings. The METR perception gap alone invalidates the most common "measurement" approach in the industry — asking developers whether they feel faster.
The 2025 DORA report on AI-assisted software development, based on survey responses from nearly 5,000 technology professionals, adds the system-level warning: AI adoption has reached 90% of software professionals, but AI acts as an amplifier — it magnifies the strengths of well-run organizations and the dysfunctions of struggling ones. Faster code generation without strong testing, version control discipline, and fast feedback loops produces instability, not throughput. Your measurement system has to be able to detect both outcomes.
The formula: how to measure ROI of AI in software engineering
Software engineering ROI follows the standard form — value minus cost, divided by cost — but both terms are routinely miscalculated. (This guide isolates the AI delta; for the tool-agnostic version of the question — valuing everything the delivery organization ships, at initiative, system, and portfolio level — see our guide to software delivery ROI.) Here is each side done properly.
The value side: cost per delivered outcome
The unit of value in software engineering is not code produced; it is outcomes delivered: a production change shipped, a roadmap item completed, a defect resolved, a legacy module retired. The cleanest way to express AI's value is the change in cost per outcome:
Cost per outcome = (engineering payroll + tooling + infrastructure for the period) ÷ outcomes delivered in the period
If your organization delivers 600 production changes per quarter on a $2.25M quarterly engineering cost, each change costs $3,750. If AI adoption lets the same team deliver 672 changes at roughly the same cost, your cost per outcome fell about 10% — a number a CFO can act on, denominated in the currency the business already uses. This framing also captures the most common real-world payoff: not headcount reduction, but reclaimed capacity — the ability to reduce an engineering backlog without growing headcount, increase engineering capacity without hiring, or pull roadmap items forward — and, when growth is the plan, to scale software engineering teams with cost per outcome held flat. It is also the right lens for cost programs generally: cutting spend while cost per outcome rises is a loss, which is why our playbook on how to reduce software development costs starts from this same unit-cost baseline.
Three rules keep the value side honest:
- Count only outcomes that reach production. Merged-but-unreleased work is inventory, not value.
- Hold quality constant. Additional throughput that raises change failure rate or defect escape rate is borrowed value, repaid with interest during incident response.
- Value capacity at its redeployment rate. Freed engineering hours are only worth something if they go to roadmap work, modernization, or debt reduction — say where they went.
The cost side: full cost accounting
Most AI ROI calculations count license fees and stop. The real first-year cost stack is considerably larger, and analyses of enterprise rollouts — LinearB's Copilot ROI breakdown is a good public example — consistently flag the hidden lines:
- Licenses and usage-based inference costs (agent workloads are metered; budget for variance)
- Enablement: training time, prompt/agent playbooks, internal champions' hours
- The ramp-up dip: productivity drops before it rises; industry analyses cite roughly an 11-week ramp before gains stabilize
- Review and verification overhead: AI shifts effort from writing code to reviewing it — METR's screen recordings showed developers spending 9% of task time reviewing and correcting AI output
- Governance and security: policy definition, scanning AI-touched code, audit trails
- Measurement infrastructure itself: instrumenting git, CI/CD, and incident data is a real (and reusable) cost
A defensible business case states all of these, then wins anyway. An indefensible one hides them, and dies in the first finance review. For the tool-by-tool version of this cost discipline — current seat and usage pricing, license-utilization audits, and expand/hold/cut thresholds per license — see our audit guide to AI coding tools ROI.
Engineering productivity metrics that actually track AI impact
No single metric survives contact with reality. Use a small portfolio in three layers — adoption (is it used? — why that number stalls and the levers that raise it are the subject of our guide to AI adoption for engineering teams), delivery (is the system faster?), and business outcomes (is it cheaper per unit of value?) — with quality counterweights wired in from day one. (For the general-purpose metrics portfolio and how to choose between DORA, SPACE, and DX Core 4 outside the AI lens, see our leader's guide to engineering productivity metrics.)
| Metric | What it proxies | How to capture it | Pitfall |
|---|---|---|---|
| Lead time for changes | End-to-end delivery speed | Git + CI/CD timestamps, first commit → production | Shrinks when PRs get smaller, even with no extra value delivered |
| Deployment frequency | Flow and batch size | CI/CD pipeline events | Gameable with trivial deploys; pair with outcome counts |
| Change failure rate | Whether speed is borrowed from quality | Deploys causing incidents/rollbacks ÷ total deploys | Under-reported without a blameless incident culture |
| Failed-deployment recovery time | Operational resilience | Incident tooling timestamps | Noisy at low incident volume; use rolling windows |
| PR cycle time / review time | Inner-loop friction; where the bottleneck moved | Git provider API | AI cuts authoring time but can inflate review time — watch the sum, not one half |
| Throughput per engineer (same-engineer, before/after) | Individual productivity change | Merged production changes per engineer vs. their own baseline | Cross-team comparisons confound tenure, domain, and seasonality |
| Defect escape rate | Quality reaching users | Production bugs tagged to release | Lags adoption by weeks; don't declare victory at day 30 |
| Rework rate / code churn | Code that didn't survive | % of lines re-modified within 2–4 weeks of merge | Some churn is healthy iteration; track the trend, not the absolute |
| Adoption (WAU/DAU, share of AI-assisted PRs) | Whether ROI is even possible | Vendor dashboards, IDE/agent telemetry | Usage is an input, never a result — 100% adoption proves nothing alone |
| Self-reported time savings | Perceived productivity, morale | Lightweight recurring survey | METR showed perception can overstate reality by ~39 points; corroborate, never headline |
| Cost per delivered outcome | The ROI backbone | (Payroll + tooling) ÷ production outcomes | Meaningless if "outcome" is defined loosely — fix the definition first |
Two notes on metrics deliberately absent from this table. Lines of code measures verbosity, not value — AI makes it strictly worse, because generated code is cheap to produce and expensive to own. Suggestion acceptance rate is a vendor engagement metric: peer-reviewed work in Communications of the ACM found acceptance rate correlates with perceived productivity — the same perception METR proved unreliable. Both belong in a tooling dashboard, not a business case.
How to measure AI developer productivity: a baseline-first methodology
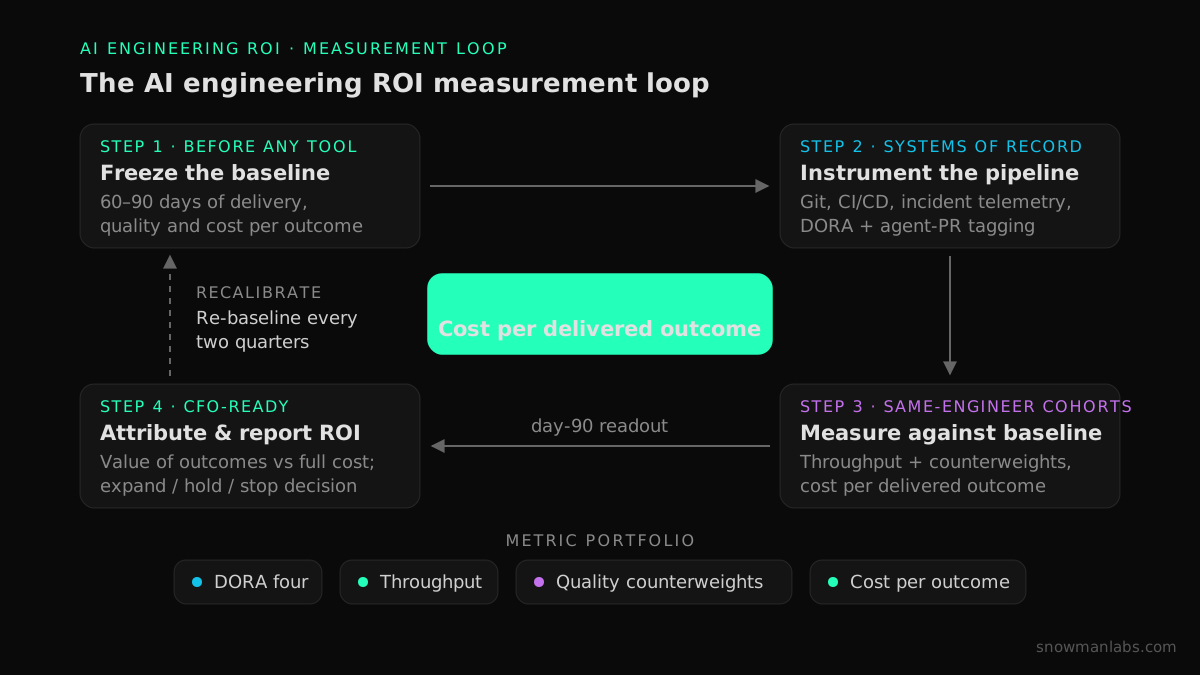
The gold standard for isolating AI's effect is same-engineer, before/after comparison: measure engineers against their own pre-AI baseline, not against other teams. This is the approach DX's measurement research calls out as the most rigorous available outside a lab, because it eliminates confounders like tenure, team composition, and codebase difficulty — and it is the methodology we use in client engagements. (For the full comparison-design ladder — before/after, matched cohorts, same-engineer analysis, controlled trials — and the confounders each one controls, see our guide to measuring the impact of AI on software teams.) Here is the process, step by step.
- Define the outcome unit. Decide what "delivered value" means in your organization — a production-deployed change, a completed roadmap item, a resolved customer-reported defect. Write the definition down; every later number depends on it.
- Freeze a 60–90 day baseline. Before rollout (or before expansion, if tools are already in), capture the four DORA metrics, PR cycle time, defect escape rate, rework rate, developer-experience survey scores, and cost per outcome. This baseline is the single highest-leverage artifact in the entire program — without it, every later claim is an estimate.
- Instrument the pipeline, not the people. Pull from systems of record — git provider, CI/CD, incident management, vendor telemetry — so measurement is automatic, continuous, and free of self-report bias. Surveillance-style individual dashboards destroy trust and corrupt the data; measure teams and cohorts.
- Pilot with a same-engineer design. Roll AI tooling to a pilot cohort of 10–20% of engineering and compare each pilot team against its own baseline. If you must compare cohorts, match them on work type — the McKinsey task-level data shows gains ranging from 50% to under 10% depending on task complexity, so a platform team and a greenfield team are not comparable.
- Roll out in waves and track leading indicators. During weeks 2–8, watch adoption (WAU), PR cycle time, and review time. Expect the J-curve: a dip during ramp-up is normal and budgeted; a dip that persists past ~11 weeks is a signal to fix enablement, not to buy more licenses.
- Compare at day 90 and compute ROI. Re-measure everything from step 2. Compute the change in cost per outcome, verify the quality counterweights held (change failure rate, defect escape, rework), and only then apply the ROI formula.
- Re-baseline every two quarters and expand. Gains compound and shift as usage matures from autocomplete to delegated agent tasks. Reset the baseline, extend measurement to new SDLC phases (test generation, documentation, migration work), and retire metrics that have stopped discriminating.
The discipline here is deliberately boring. That is the point: boring methodology is what makes the eventual number — whatever it is — credible in front of a CFO or a board. For the measurement layer underneath this methodology — the frameworks (DORA, SPACE, DX Core 4), the full metric portfolio, and the data-collection methods — see our field guide on how to measure AI developer productivity.
Adapting DORA metrics for AI-assisted teams
The four DORA metrics — lead time for changes, deployment frequency, change failure rate, and failed-deployment recovery time — remain the best-validated engineering productivity metrics available, but AI changes how you read them. The 2025 DORA research found that AI-driven acceleration exposes downstream weakness: more change volume without strong automated testing and fast feedback loops shows up as instability, not speed. Concretely, that means treating the two throughput metrics and the two stability metrics as a paired system: a lead-time improvement only counts if change failure rate held or improved over the same window.
For AI-assisted teams we recommend three adaptations: segment every DORA metric by AI-assisted vs. non-assisted work where telemetry allows; add rework rate as a fifth metric, because AI's failure mode is plausible code that gets rewritten within a sprint; and extend measurement windows to at least 90 days to clear the ramp-up J-curve. We cover the full adaptation — including instrumentation details and anti-gaming design — in our companion guide to DORA metrics for AI-assisted software teams.
Where AI produces the most measurable value
ROI concentrates unevenly across the software development lifecycle, and knowing where to look sharpens both the pilot design and the business case. The task-level evidence — McKinsey's controlled comparisons are the most granular public data — points to a consistent hierarchy:
- Documentation and code explanation (highest, ~45–50% time savings). Low risk, easy to verify, and disproportionately valuable in codebases where documentation debt blocks onboarding. Measure via documentation coverage and time-to-first-commit for new engineers.
- Test generation and boilerplate (~35–45%). High-volume, well-specified work where AI's pattern strength dominates. Measure via test coverage delta and authoring time on instrumented repositories.
- Well-scoped feature work in modern codebases (~35–45%). The territory of GitHub's 55% result. Measure via same-engineer throughput and PR cycle time.
- Refactoring and structured migration (~20–30%). Gains are real but demand stronger verification. This band is where AI-assisted legacy modernization lives — repetitive transformation across large surfaces, where AI handles volume and senior engineers own the architecture and the acceptance criteria. Measure via cost per migrated module and post-migration defect rates.
- Novel, high-complexity work in mature systems (lowest, often under 10% — sometimes negative). METR's territory. Measure honestly, expect little, and don't let this segment's flat results discredit the gains elsewhere.
Two implications follow. First, pilot where the signal is strongest — a pilot built on documentation-heavy or test-heavy work produces a clean early readout, while a pilot on your gnarliest subsystem produces a false negative. Second, weight the portfolio in the business case: your projected gain should be the task-mix-weighted average of these bands for your backlog, not a single vendor headline number. An organization whose backlog is 60% maintenance in a fifteen-year-old monolith should not project the same returns as one shipping greenfield features — but it may capture larger absolute value from AI-assisted modernization, because that is where its spend is. Knowing where the value concentrates is half the job; actually capturing it is an operational program of task routing, review capacity, and enablement — the six levers in our guide to improving developer productivity with AI.
Six common mistakes when you measure AI developer productivity
Most failed AI measurement programs fail the same six ways. Check your current dashboard against this list before presenting anything upward.
- Counting lines of code or commits. Volume metrics invert under AI: generation is nearly free, so more code often means more surface area to review, test, and maintain. If anything, treat unusual code volume growth as a risk indicator.
- Headlining suggestion acceptance rate. It measures engagement with the tool, correlates with perceived (not actual) productivity, and is trivially inflated by developers accepting then rewriting suggestions.
- Trusting self-reported time savings. METR's 39-point perception gap is the definitive caution. Surveys are valuable for morale, friction discovery, and adoption diagnostics — as corroboration, never as the headline number.
- Comparing across teams instead of within them. Team A with AI vs. Team B without confounds domain, codebase age, and talent. Same-engineer before/after is cheaper and far more defensible.
- Measuring at day 30. You will capture the ramp-up dip and conclude the program failed, or capture novelty enthusiasm and conclude it succeeded. Quality signals (defect escape, rework) need 8–12 weeks to become meaningful.
- Reporting throughput without quality counterweights. A 20% throughput gain with a rising change failure rate is a slow-motion incident report. Every speed metric in your executive deck needs its paired stability metric on the same slide — and which metrics belong on which slide, from board to team level, is the subject of our scorecard of AI productivity metrics for engineering leaders.
Quality and governance: the counterweight metrics
Every AI ROI program needs a set of metrics whose explicit job is to catch the downside. AI-generated code fails differently from human code: it is syntactically confident, contextually naive, and produced at a volume that overwhelms traditional review. The counterweight set we deploy alongside every throughput dashboard:
- Change failure rate and defect escape rate — the canonical "was the speed real?" checks
- Rework rate on AI-authored code — code rewritten within 2–4 weeks of merge, segmented by authorship
- Review load and review depth — total review hours and comments per changed line; AI moves the bottleneck from writing to verifying, and unmonitored review queues silently absorb the gains
- Security findings per release in AI-touched code — SAST/DAST results segmented by AI assistance
- Production incident attribution — whether incidents trace disproportionately to AI-assisted changes
Governance is not a tax on ROI; it is what makes the ROI durable. Runtime verification in particular — knowing how AI-generated code actually behaves in production, not just whether it passed review — is the difference between shipping faster and merely merging faster. We go deep on this in production-safe AI-generated code and why runtime context matters.
A worked example: 50-engineer organization
The following numbers are illustrative, not client data — they exist to show the mechanics, and every input should be replaced with your own measurements.
The setup. A 50-engineer organization with a fully loaded cost of $180,000 per engineer: $9.0M annual, $2.25M quarterly. The frozen baseline shows 600 production changes per quarter, so the baseline cost per outcome is $3,750.
Year-one program cost (illustrative):
| Cost line | Amount |
|---|---|
| Licenses + metered agent usage | $70,000 |
| Enablement (training time, playbooks, champions) | $90,000 |
| Ramp-up productivity dip (budgeted) | $100,000 |
| Governance + measurement instrumentation | $50,000 |
| Total year one | $310,000 |
Measured result at day 90–180 (illustrative). Throughput rises 12% to 672 changes per quarter; change failure rate, defect escape rate, and rework hold flat — the gain is real, not borrowed. New cost per outcome: ($2,250,000 + $17,500 quarterly tooling) ÷ 672 = $3,374, a 10% reduction.
The ROI calculation. The 72 additional quarterly changes, valued at the baseline cost per outcome, represent $270,000 per quarter of capacity the organization did not have to hire for. Assuming gains are realized in the second half of year one (the ramp is why): value = 2 × $270,000 = $540,000 against $310,000 of cost.
First-year ROI = ($540,000 − $310,000) ÷ $310,000 ≈ 74%, with a payback period of roughly seven months and a steady-state run rate of ~$1.08M per year in capacity against ~$100K in recurring costs.
Notice what carried this case: a modest, honestly measured 12% throughput gain on a $9M payroll. That is consistent with the field's real-world benchmarks — DX reports median throughput gains of 5–15% across enterprises, far below vendor claims of 2–10x — and it is still an unambiguous yes for the CFO. You do not need inflated numbers; you need clean ones. The gap between 12% and the 40–60% time-to-market reductions we target in agentic engineering engagements comes from changing the delivery system itself — parallel agent capacity, redesigned verification, senior oversight — not from handing out licenses, which is precisely why licenses alone plateau.
The same initiative-level discipline — fully loaded costs, explicit conversion of hours into dollars, adoption-scaled value — applies beyond AI tooling to every productivity bet in the portfolio: platform teams, DevEx programs, CI/CD investment. We generalize the method, with its own worked example and benchmarks, in developer productivity ROI: from hours saved to dollars.
Building the AI engineering business case your CFO will sign
An AI engineering business case succeeds when it is denominated in outcomes, states its own risks, and shows sensitivity to its weakest assumption. Structure it in five parts:
- Baseline statement. The frozen 60–90 day metrics: cost per outcome, DORA four, quality indicators. One page, sourced from systems of record.
- Full cost stack. All six cost categories from the section above, year one and steady state, with the ramp-up dip explicitly budgeted. Pre-empting the "what about hidden costs?" question is worth more than any benefit slide.
- Value model in cost-per-outcome terms. Projected throughput gain, valued at baseline cost per outcome, with the redeployment plan for freed capacity (backlog reduction, modernization, roadmap pull-forward). Show a sensitivity table at half and double your projected gain — a case that survives at 6% is fundable; one that needs 25% is a hope.
- Quality and governance counterweights. The metrics that will catch a downside, the thresholds that trigger intervention, and who owns them. CFOs fund programs with brakes.
- The decision cadence. Measurement checkpoints at day 90 and 180 with pre-committed expand/hold/stop criteria. This converts a bet into a managed investment.
Tailor the emphasis per audience: the CFO wants cost per outcome and payback period; the CEO wants roadmap acceleration and competitive positioning; the engineering organization wants proof that measurement targets systems, not individuals. If you want the commercial version of this framework — including how we structure measurement in delivery engagements — see our AI software engineering ROI services.
The 90-day measurement plan
Compressing the methodology into a quarter looks like this:
- Days 1–15 — Instrument and freeze the baseline. Connect git, CI/CD, and incident tooling to a metrics store; define the outcome unit; publish the baseline. If AI tools are already deployed without a baseline, segment by adoption cohort and use the lowest-adoption cohort as a reference — imperfect, but honest.
- Days 16–45 — Pilot with the measurement running. Enable the pilot cohort, run enablement, and track adoption plus leading indicators (PR cycle time, review time) weekly. Expect and message the J-curve so nobody panics — or celebrates — early.
- Days 46–90 — First comparison and decision. Re-measure the full metric set, compute the change in cost per outcome, verify the counterweights, and present against the pre-committed expand/hold/stop criteria.
Measurement and enablement are two halves of the same program: measurement without enablement documents a plateau, and enablement without measurement is a leap of faith. We pair this plan with the rollout side in the 90-day AI engineering enablement plan.
Where autonomous agents change the math
Everything above holds for assistant-style tools; delegated coding agents (Cognition's Devin, Replit Agent, and similar platforms) change two variables in the equation. First, cost becomes metered and elastic — you pay per unit of agent work, which makes cost per outcome directly observable per task rather than amortized across licenses. Second, capacity becomes parallel — a senior engineer directing multiple concurrent agent workstreams breaks the one-engineer-one-task assumption behind per-engineer productivity metrics, so the unit of measurement shifts from the individual to the engineer-plus-agents delivery cell: outcomes per cell, cost per merged agent PR, and human verification hours per agent outcome.
The verification line is the one to watch. Agent output that is merely merged is not yet value; runtime intelligence tooling such as Hud — which observes how code actually behaves in production — is what lets a lean senior team supervise agent volume without the review queue becoming the new bottleneck. This operating model, and how it differs from tool adoption, is the subject of our comparison of agentic engineering vs. AI-assisted development; the measurement discipline in this guide is what tells you, in your own numbers, whether either is paying off.
FAQ
How do you calculate the ROI of AI coding tools?
Use ROI = (value of additional delivered outcomes − fully loaded cost) ÷ fully loaded cost, measured against a pre-adoption baseline. Value the outcomes at your baseline cost per outcome (engineering cost ÷ production changes delivered), and include licenses, enablement, the ramp-up dip, review overhead, and governance in the cost. Never calculate from lines of code, acceptance rates, or self-reported time savings alone.
What is a good ROI for AI in software engineering?
Honestly measured organizational gains typically land well below vendor marketing: DX's cross-company benchmarks put median throughput improvements at 5–15%, and enterprise cases commonly show payback in one to three quarters. Because the gain applies to your entire engineering payroll, even a 10% improvement on a $9M cost base is roughly $900K per year in capacity — modest percentages produce strong absolute returns.
Do AI coding tools actually make developers faster?
It depends on the task, the codebase, and the surrounding system. Controlled studies show large gains on well-scoped tasks — GitHub measured 55% faster completion; McKinsey found 35–50% savings on generation and documentation — while METR's randomized trial found experienced developers were 19% slower on complex work in mature codebases. The honest answer for your organization only comes from measuring your own teams against their own baseline.
How long does it take to see ROI from AI coding tools?
Expect a J-curve: a productivity dip during the first several weeks, with industry analyses citing roughly 11 weeks before gains stabilize. Leading indicators like PR cycle time move within 2–4 weeks; trustworthy quality-adjusted results need 90 days; a full business-case validation typically takes two quarters. Any measurement taken at day 30 mostly reflects the ramp, in either direction.
What metrics should I use to measure AI developer productivity?
Use a three-layer portfolio: adoption metrics (weekly active use, share of AI-assisted PRs), delivery metrics (the four DORA metrics plus PR cycle time and rework rate), and business metrics (cost per delivered outcome). Pair every throughput metric with a quality counterweight — change failure rate, defect escape rate — and prefer same-engineer before/after comparisons over cross-team ones.
Why don't individual productivity gains show up in delivery metrics?
Because delivery is a system, individual speed-ups pool at the next constraint — usually code review, testing, or deployment approvals. The 2025 DORA report frames AI as an amplifier: organizations with strong feedback loops convert individual gains into delivery performance, while others convert them into larger review queues and instability. If adoption is high but lead time is flat, look for the displaced bottleneck rather than blaming the tool — the stage-by-stage playbook for finding and fixing it is in how to improve software delivery cycle time, and the organization-level sequencing of fixes (flow, pipeline, AI, structure) is in our guide to accelerating software delivery.
What are the downsides of AI coding tools that affect ROI?
The main ROI erosions are review and verification overhead (effort moves from writing to checking), elevated rework and code churn, quality regressions that surface weeks later as defects or incidents, and governance costs for security and compliance of AI-touched code. None of these eliminate positive ROI, but unmeasured, they silently consume it — which is why counterweight metrics belong in the program from day one.
Conclusion: measure like the money depends on it
The organizations that win with AI in engineering are not the ones with the most licenses; they are the ones that can say, with evidence, what changed, by how much, and at what cost. The formula is simple — value of additional outcomes over fully loaded cost — and everything else in this guide exists to make both numbers trustworthy: a frozen baseline, same-engineer comparisons, DORA metrics with quality counterweights, and a decision cadence with pre-committed criteria. Do that, and even a modest measured gain becomes a fundable, expandable program instead of a debate about anecdotes.
If you want a grounded read on where your organization stands before you commit budget, start with our AI Readiness Diagnostic — it benchmarks your current delivery system and identifies where AI investment will (and won't) produce measurable returns — or explore how we engineer and prove AI ROI in delivery engagements.
Find your highest-value path to agentic delivery.
Map your readiness, delivery constraints, and first 90-day opportunity with the Snowman Labs AI Readiness Diagnostic.