Software Delivery ROI: How to Measure What Shipping Returns
Measure software delivery ROI at three levels — initiative, delivery system, portfolio — with a DORA-to-dollars translation, benchmarks, and a worked example.
 By Danilo Brizola
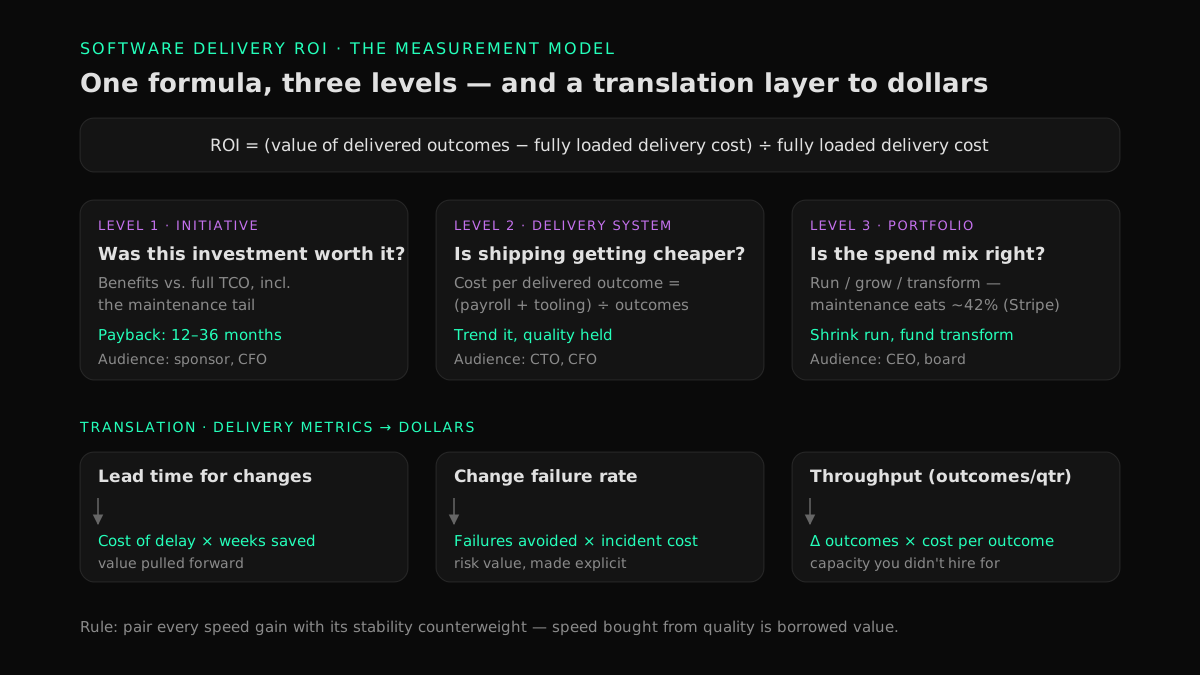
Software delivery ROI is the return on everything it costs your organization to ship software — payroll, tooling, infrastructure, and maintenance — expressed as (value of delivered outcomes − fully loaded delivery cost) ÷ fully loaded delivery cost. Most organizations can quote the cost side to the dollar and cannot quantify the value side at all, which is why engineering shows up in the P&L as a cost center and gets managed like one.
This guide is for CIOs, CTOs, and VPs of Engineering who need to answer the question "what are we getting for this?" with numbers a CFO will accept. It covers the formula and the two places it goes wrong, a three-level model for measuring delivery ROI (initiative, delivery system, portfolio), how to translate delivery metrics into dollars, honest benchmarks, and a worked example you can rebuild with your own inputs.
What software delivery ROI actually measures
Software delivery ROI measures the return on the delivery function, not just on individual projects: it asks whether the entire system that turns roadmap into production software creates more value than it consumes. That distinction matters because most published "software ROI" guidance is written for a one-off build — a single custom application with a start date, an end date, and a contract price. An engineering organization is not a project. It is a continuous system with ongoing costs, compounding assets, and a maintenance tail, and it needs to be measured like one.
The formula itself is the standard one:
Software delivery ROI (%) = (value of delivered outcomes − fully loaded delivery cost) ÷ fully loaded delivery cost × 100
Both terms are routinely miscalculated, in opposite directions. The cost side is usually undercounted — license fees and salaries get in; maintenance, coordination, enablement, and the cost of delay do not. The value side is usually either not counted at all ("engineering is a cost center") or overcounted with soft benefits nobody converted into dollars ("improved agility"). The rest of this guide is about getting both terms right.
Why most organizations can't answer the ROI question
The honest baseline: most technology leaders cannot connect delivery work to financial results. PwC's executive Pulse Survey found that 88% of executives consider achieving measurable value from technology adoption a challenge — not achieving the value, measuring it. Four structural reasons keep the question unanswered:
- Attribution is genuinely hard. Revenue is produced by product, sales, marketing, and engineering together; no ledger line says "this $2M came from the checkout rewrite." ROI models handle this with explicit, stated attribution assumptions — not by giving up.
- Value lags cost. Delivery cost is booked monthly; the return on a platform investment arrives over 12–36 months. Judged on a one-quarter window, almost every good engineering investment looks bad.
- The accounting frame is wrong. When engineering is budgeted purely as a cost center, the only "improvement" the system can register is spending less — which is how organizations cut their way into slower delivery and higher cost per delivered outcome.
- Nobody froze a baseline. Without a before-picture of throughput, quality, and unit cost, every later claim is an anecdote.
The cost of leaving the question unanswered is not just budget friction. McKinsey's Developer Velocity research across 440 companies found that top-quartile organizations on its Developer Velocity Index grow revenue four to five times faster than bottom-quartile peers. Delivery performance is a business variable. Measuring its return is how you get permission to invest in it.
The three levels of software delivery ROI
Delivery ROI is measured at three levels, and confusion between them is the most common source of bad numbers. Each level has its own question, its own math, and its own audience.
| Level | Question it answers | Core math | Audience |
|---|---|---|---|
| 1. Initiative | Was this specific investment worth it? | Initiative benefits − initiative TCO ÷ TCO | Sponsor, CFO |
| 2. Delivery system | Is our capacity to ship getting cheaper or more expensive? | Cost per delivered outcome, trended | CTO, CFO |
| 3. Portfolio | Is the overall mix of engineering spend positioned right? | Run / grow / transform allocation vs. returns | CEO, board |
Level 1: initiative ROI
The classic case: a rebuild, a new product capability, a platform investment. Compute the full cost of the initiative (build plus its maintenance tail — not just the build), estimate benefits in one or more of the four value categories below, and state the evaluation window. Industry analyses consistently put typical payback for well-executed software initiatives at 12–36 months, with custom builds usually landing in the 12–24 month band. An initiative case that needs five years to break even is not automatically wrong — but it should be argued as a strategic bet, not disguised as a quick win.
Level 2: delivery-system ROI — cost per software delivery outcome
The level most organizations skip, and the one that makes the other two trustworthy. Define an outcome unit — a production-deployed change, a completed roadmap item — and track:
Cost per delivery outcome = (engineering payroll + tooling + infrastructure for the period) ÷ outcomes delivered in the period
A 40-engineer organization spending $1.7M per quarter and shipping 400 production changes runs at $4,250 per change. That single number turns delivery performance into unit economics: every durable improvement in lead time, review flow, or rework lowers it, and every regression raises it. It is also the honest way to evaluate cost programs — cutting spend while cost per outcome rises is a loss dressed up as savings. This unit-economics framing is the backbone of our hub's approach to measurement; the ROI measurement pillar applies it specifically to isolating what AI tooling returns.
Level 3: portfolio ROI
At the portfolio level the question is allocation: how much of delivery capacity goes to running the business (keep-the-lights-on and maintenance), growing it (new capability), and transforming it (modernization, platform, tooling)? The uncomfortable industry reality is that maintenance dominates: Stripe's Developer Coefficient study estimated developers spend roughly 42% of their working week on maintenance, technical debt, and bad code. A portfolio where "run" quietly consumes two-thirds of capacity has a structural ROI ceiling no initiative-level win can fix — which is usually the strongest financial argument for modernization work that shrinks the run bucket.
Counting the cost side: the full delivery TCO
Undercounted costs are the quietest way an ROI number becomes fiction. A defensible delivery cost stack includes:
- People, fully loaded — salary plus benefits, employer taxes, equipment, and management overhead; loaded cost typically runs 1.25–1.4× base salary
- Tooling and infrastructure — cloud, CI/CD, observability, licenses (including AI tooling and metered agent usage)
- Quality and security — testing infrastructure, review time, audits, compliance work
- Maintenance and support — the tail on everything already shipped; for most portfolios this is the largest line after payroll
- Enablement and change — training, onboarding, documentation, the ramp-up dip on any new tool or process
- Cost of delay — not a ledger line, but the value forgone while work queues; it belongs in initiative comparisons even when finance won't book it
The discipline is symmetry: if you claim a benefit category, you must carry its cost category. Counting AI-tool throughput gains while omitting review overhead and governance, for example, is the exact failure mode our AI coding tools ROI audit guide is built to catch.
Counting the value side: four categories, converted or discarded
Delivery value falls into four categories. The rule that keeps the number honest: a benefit only enters the ROI calculation once it is converted into dollars with a stated assumption — otherwise it is narrative, and belongs in the narrative section.
- Revenue creation. New capability that opens revenue: a product line, a channel, capacity constraints removed. Convert via attributed revenue × a stated attribution share, agreed with finance up front.
- Cost reduction and avoidance. Automation of manual work, retired vendor spend, infrastructure efficiency, hiring avoided because existing capacity got cheaper per outcome. Convert via hours saved × loaded rate, or contracts actually canceled — not list prices.
- Risk reduction. Fewer and shorter incidents, lower change failure rate, compliance findings closed. Convert via incident frequency × average incident cost (downtime revenue impact, response hours, SLA penalties).
- Strategic option value. Faster time-to-market and the ability to respond to change. The hardest to convert and the most abused; the defensible conversion is cost of delay — the margin a specific initiative earns per week, times the weeks a delivery improvement saves. If you cannot name the initiative and the number, leave it out.
Hard-versus-soft is not a property of the category; it is a property of the conversion. "Developer time saved" is soft until you show where the freed hours went — roadmap items pulled forward, backlog burned down — and hard once you do.
From delivery metrics to dollars
Delivery metrics — the DORA four and their supporting cast — are the instrumentation layer of delivery ROI, not the ROI itself. A lead-time chart is engineering telemetry; the translation into money is what finance can act on:
| Delivery metric | Financial translation | How to compute |
|---|---|---|
| Lead time for changes | Value pulled forward | Cost of delay of affected initiatives × weeks saved |
| Deployment frequency | Lower batch risk and rework | Rollback + rework hours avoided × loaded rate |
| Change failure rate | Incident cost avoided | Failures avoided × average cost per incident |
| Failed-deployment recovery time | Downtime cost avoided | Hours of downtime avoided × revenue (or penalty) per hour |
| Throughput (outcomes/quarter) | Capacity value | Additional outcomes × baseline cost per outcome |
| Rework rate | Waste eliminated | Reworked hours avoided × loaded rate |
Two rules govern the translation. First, throughput gains and stability gains must be reported as a pair — speed bought by raising the change failure rate is borrowed value, repaid with interest during incident response. Second, every translated number inherits the quality of its baseline, which is why the metrics program comes before the ROI program: our guides to engineering productivity metrics and DORA metrics for AI-assisted teams cover that instrumentation layer in depth.
What is a good software delivery ROI?
Benchmarks for software ROI are weak, and pretending otherwise is how bad business cases get built. Commonly cited figures put a "good" IT project return anywhere from 5–10% at the conservative end to 20%+ as a strong target, while agency content claims 30–200% depending on what gets counted — a spread wide enough to tell you the real answer: the benchmark that matters is your own baseline, trended. Three standards hold up in front of a CFO:
- Direction: cost per delivered outcome falling, quarter over quarter, with quality counterweights flat or improving.
- Payback: initiative investments recovering their cost inside 12–36 months, stated with the evaluation window up front.
- Sensitivity: the case still clears zero when its weakest assumption is halved. An ROI that only works at full projected benefit is a hope, not a case.
A worked example: delivery-system investment
The numbers below are illustrative, not client data — the point is the mechanics.
Setup. A 40-engineer organization, $170K fully loaded per engineer: $6.8M annual, $1.7M quarterly. Baseline: 400 production changes per quarter (cost per outcome $4,250), change failure rate 4.5%, average cost per failed change (response time, rollback, downtime) $12,000.
Investment. A year-one delivery-system program — deployment automation, test infrastructure, review-flow redesign, and governed AI-assisted capacity — costing $450,000 including enablement and a budgeted ramp-up dip.
Measured result (day 90–180). Throughput rises 15% to 460 changes per quarter with quality counterweights holding; change failure rate falls to 3.0%.
Translation.
- Capacity value: 60 additional changes × $4,250 = $255,000 per quarter
- Risk value: ~7 failed changes avoided per quarter × $12,000 = $84,000 per quarter
- Benefits realized in the second half of year one: 2 × ($255,000 + $84,000) = $678,000
First-year ROI = ($678,000 − $450,000) ÷ $450,000 ≈ 51%, with payback landing early in the fourth quarter and a steady-state run rate of roughly $1.35M per year against recurring costs a fraction of that size.
Note what carried the case: a modest, honestly measured 15% throughput gain plus a stability improvement, valued at the organization's own unit costs. No heroic assumptions, no soft value smuggled in — and still an unambiguous yes.
Five mistakes that corrupt the number
- No frozen baseline. Measuring after the change against memory of before. Fix: 60–90 days of throughput, quality, and unit-cost data before any program starts.
- Unconverted soft value. "Improved agility" as a benefit line. Fix: converted-or-discarded, per the four categories above.
- Ignoring the maintenance tail. Costing the build and not the 40%+ of lifetime cost that follows it. Fix: TCO over the stated window, always.
- Measuring activity instead of outcomes. Story points, commits, and lines of code inflate under pressure and say nothing about value; count production outcomes only.
- A window shorter than the J-curve. Platform and tooling investments dip before they climb; judged at day 30 they all fail. Fix: pre-committed checkpoints at 90 and 180 days.
How AI changes the delivery ROI equation
AI tooling raises the stakes on exactly this measurement discipline, because it moves both sides of the formula at once: throughput up, but also review load, rework risk, and metered costs up. The 2025 DORA report frames AI as an amplifier — organizations with strong delivery systems convert AI adoption into throughput, while weak ones convert it into instability. That makes a delivery-ROI baseline the prerequisite for any credible AI investment case: you cannot attribute a delta you never measured the starting point of. The AI-specific methodology — same-engineer baselines, counterweight metrics, the full cost stack for AI programs — is the subject of our pillar on how to measure ROI of AI in software engineering.
Reporting delivery ROI upward
The reporting format matters nearly as much as the math. What works in front of a CFO and board: one page per level — the portfolio allocation and its trend, the delivery system's cost per outcome curve, and the two or three initiative cases currently in flight, each with its payback line and its pre-committed expand/hold/stop checkpoint. State attribution assumptions in writing, show sensitivity at half the projected benefit, and pair every speed claim with its stability counterweight. The full structure — scenarios, risk register, decision cadence — is in our guide to building the business case for AI engineering, and the commercial version of this measurement discipline, as we run it inside delivery engagements, is described on our software engineering ROI services page.
FAQ
How do you calculate the ROI of software development?
Use ROI = (value of delivered outcomes − fully loaded cost) ÷ fully loaded cost × 100, over a stated evaluation window of 12–36 months. Count the full cost stack (people, tooling, maintenance tail, enablement) and only count benefits that have been converted to dollars with a stated assumption — attributed revenue, hours saved at loaded rates, incident costs avoided.
What is a good ROI for a software project?
Published benchmarks range from 5–10% (conservative IT-project standards) to 20% and up for strong performers, with payback typically expected inside 12–36 months. The spread is wide because "benefits" are counted inconsistently — so the more useful standard is your own baseline: unit cost per delivered outcome falling while quality holds, and initiative payback inside the stated window.
What is the difference between ROI and payback period?
ROI measures the efficiency of an investment — return as a percentage of cost over a window. Payback period measures speed — how long until cumulative benefits equal the investment. A CFO typically wants both: ROI tells them whether the investment is worth making, payback tells them how long the capital is exposed.
How do DORA metrics relate to software delivery ROI?
DORA metrics are the instrumentation layer: lead time, deployment frequency, change failure rate, and recovery time measure the delivery system's speed and stability. They become ROI inputs through translation — throughput gains valued at cost per outcome, failure-rate improvements valued at incident cost avoided, lead-time reductions valued at cost of delay. A DORA improvement with no financial translation is telemetry, not ROI.
What is the difference between hard and soft ROI?
Hard ROI is directly measurable in money — revenue attributed, contracts canceled, incident costs avoided. Soft ROI covers real but indirect value: developer time saved, agility, satisfaction. The practical rule is that soft value must be converted (where did the saved hours go?) before it enters the calculation; unconverted soft value belongs in the narrative, not the number.
Is software engineering a cost center or a value center?
Accounting will usually book it as a cost center, but managing it purely as one guarantees underinvestment, because the only visible improvement becomes spending less. The alternative is unit economics: track cost per delivered outcome and the value categories delivery feeds. That reframes the budget conversation from "how much does engineering cost" to "what does a unit of delivered software cost us, and is it getting cheaper."
Conclusion: the baseline is the business case
Software delivery ROI is not a number you look up; it is a capability you build — an outcome definition, a frozen baseline, unit costs, and a translation layer from delivery metrics to dollars. Organizations that build it get compounding returns on the measurement itself: every future initiative case, tooling decision, and modernization argument gets cheaper to make and harder to dispute. Organizations that don't will keep having the budget conversation on the CFO's terms, with anecdotes.
If you want a grounded read on where your delivery system stands — and where investment will actually produce measurable returns — start with our AI Readiness Assessment, or see how we instrument and prove delivery ROI inside engagements.
Find your highest-value path to agentic delivery.
Map your readiness, delivery constraints, and first 90-day opportunity with the Snowman Labs AI Readiness Diagnostic.