Engineering Productivity Metrics: What to Track in 2026
A leader's guide to engineering productivity metrics: 12 metrics worth tracking, DORA vs. SPACE vs. DX Core 4, anti-patterns, and a 90-day rollout plan.
 By Danilo BrizolaUpdated
 Engineering productivity metrics are the measures an organization uses to understand how effectively its engineering system converts effort into delivered outcomes — speed, quality, capacity, and business impact, read together rather than in isolation. The operative word is system: forty years of failed attempts to score individual developers (lines of code in the 1980s, commit counts in the 2020s) have converged on a hard-won consensus that useful measurement targets teams and delivery pipelines, pairs every speed metric with a quality counterweight, and treats no single number as the answer.
This guide is for CTOs, VPs of Engineering, and directors who need a metrics program that survives contact with both their engineers and their CFO. It covers the twelve metrics worth tracking, how the three dominant frameworks — DORA, SPACE, and DX Core 4 — compare and when to use each, the anti-patterns that quietly corrupt measurement programs, what changes once AI writes a meaningful share of the code, and a 90-day rollout plan. For the companion question — turning these metrics into a dollars-denominated business case — see our pillar guide on how to measure ROI from AI in software engineering.
What engineering productivity metrics actually measure
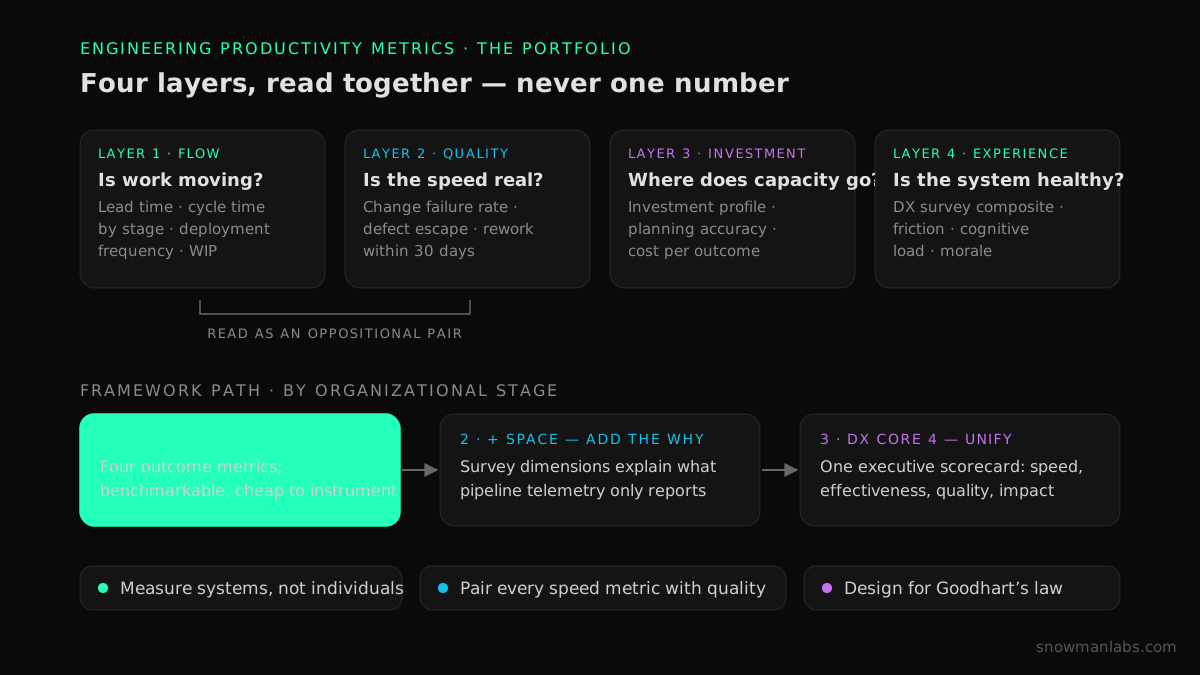
A productivity metric is a proxy, not a truth. Cycle time proxies flow; deployment frequency proxies batch size and confidence; change failure rate proxies whether the speed is real. Every proxy can be gamed, which is why mature programs are built on three design rules:
- Measure the system, not the person. Delivery is a pipeline with shared constraints — code review, test infrastructure, deployment approvals. Individual speedups pool at the next bottleneck, so individual scores misattribute both credit and blame. The 2025 DORA report, drawing on nearly 5,000 survey responses, frames the delivery system as an amplifier: the same inputs produce throughput in well-run organizations and instability in struggling ones.
- Pair opposing metrics. Any speed metric reported alone invites borrowing from quality. Lead time belongs on the same page as change failure rate; throughput belongs next to rework. The DX Core 4 formalizes this as "oppositional metrics" — gaming one visibly degrades another.
- Expect Goodhart's law. When a measure becomes a target, it stops being a good measure. Track commit counts and commits get smaller; track ticket throughput and tickets get split. Design for this up front: publish metric definitions to everyone measured, review the portfolio quarterly, and retire metrics that have stopped discriminating.
Done well, a metrics program answers four questions on one page: is work flowing, is quality holding, is capacity going to the right things, and is the organization healthier than last quarter?
12 engineering productivity metrics worth tracking
The portfolio below spans four layers — flow, quality, investment, and experience. Almost all of it can be captured automatically from systems of record (git provider, CI/CD, incident tooling), which matters: self-reported data carries documented perception bias, and manual collection dies within a quarter.
| Metric | What it tells you | How to capture it | Pitfall |
|---|---|---|---|
| Lead time for changes | End-to-end delivery speed, commit → production | Git + CI/CD timestamps | Shrinks when PRs get smaller with no extra value delivered |
| Cycle time (by stage) | Where the bottleneck lives: authoring, pickup, review, deploy | Git provider API | Averages hide the tail; watch the 75th–90th percentile |
| Deployment frequency | Batch size and release confidence | CI/CD pipeline events | Gameable with trivial deploys; pair with outcome counts |
| Change failure rate | Whether speed is borrowed from quality | Deploys causing incidents/rollbacks ÷ total deploys | Under-reported without a blameless incident culture |
| Failed-deployment recovery time | Operational resilience | Incident tooling timestamps | Noisy at low incident volume; use rolling windows |
| Merge frequency | Team-level flow of completed work | Merged PRs per team per week | A volume metric — never compare individuals on it |
| Defect escape rate | Quality reaching users | Production bugs tagged to release | Lags the work by weeks; read quarterly |
| Rework / code churn | Code that didn't survive | % of lines re-modified within 2–4 weeks of merge | Some churn is healthy iteration; track the trend |
| Work in progress (WIP) | Overload and context-switching | Open items per engineer/team in the tracker | High WIP is a system problem, not an individual one |
| Planning accuracy | Predictability of commitments | Work completed ÷ work planned per iteration | Punishing misses teaches sandbagging, not accuracy |
| Investment profile | Where capacity actually goes | Work items classified: features, debt, toil, incidents | Classification drifts without a quarterly audit |
| Developer experience score | Friction, cognitive load, morale | Recurring survey composite (e.g., DXI) | Corroborates telemetry; never replaces it |
Two deliberate absences. Lines of code measures verbosity — a developer who deletes code produces negative output by that measure while creating real value — and AI code generation has made it strictly worse as a signal. Velocity in story points is a local planning tool; points are team-relative by construction, so cross-team velocity comparisons are arithmetic on incompatible units.
If the portfolio feels large, start with four: lead time, change failure rate, investment profile, and a developer experience survey. That quartet covers speed, quality, allocation, and health — one metric per question — and every framework below is an elaboration of it.
DORA vs. SPACE vs. DX Core 4: choosing a framework
The three dominant frameworks compose rather than compete, but they answer different questions and suit different organizational stages.
| Framework | What it is | Strengths | Limitations |
|---|---|---|---|
| DORA | Four outcome metrics (deployment frequency, lead time, change failure rate, recovery time) backed by a decade-plus research program | The longest-running rigorous research base in the field; outcome-level and hard to inflate; industry benchmarks available | Says nothing about where in the inner loop time goes, or about experience and allocation |
| SPACE | Five dimensions — Satisfaction, Performance, Activity, Communication, Efficiency — published via ACM Queue by Forsgren et al. | The definitive argument that productivity is multi-dimensional; catches morale and flow effects telemetry misses | A menu, not a metric set: it names dimensions but prescribes no specific metrics, so teams struggle to operationalize it |
| DX Core 4 | Four dimensions (speed, effectiveness, quality, impact) with prescribed metrics, encapsulating DORA, SPACE, and DevEx | Prescriptive and fast to stand up; oppositional-by-design; field data from hundreds of organizations reports 3–12% efficiency gains after adoption | Newer and less independently validated; some metrics (diffs per engineer) can encourage harmful behavior if read individually |
A practical selection rule by stage:
- Starting from zero: adopt the four DORA metrics plus an investment profile. They are well-defined, benchmarkable, and cheap to instrument.
- DORA in place, but it plateaus or misses the "why": layer in SPACE thinking through a quarterly developer experience survey — satisfaction and flow explain movements the pipeline data only reports.
- Ready to report a unified scorecard upward: move to the DX Core 4 structure, which folds the other two into one page an executive team can read.
Independent analyses — Swarmia's comparison of the three frameworks is a fair one — converge on the same caveat: every framework identifies where you stand and none prescribes what to change. The metrics locate the constraint; the improvement work is still engineering leadership.
How not to measure: the anti-patterns
More metrics programs die from measuring the wrong thing than from measuring nothing. Four failure modes account for most of the wreckage:
- Ranking individual developers. When McKinsey proposed individual developer productivity scoring in 2023, the response from practitioners — Kent Beck and Gergely Orosz's rebuttal is the canonical one — was that activity-count scoring misreads software work and backfires organizationally. Engineers optimize the scored number, collaboration (reviewing, mentoring, unblocking) collapses because it scores as zero, and the dataset corrupts within a quarter.
- Output metrics as targets. Lines of code, commit counts, PRs per engineer. All three inflate on command, and the inflation has negative value: sprawling functions, split commits, sliced tickets.
- Weaponized predictability. Planning accuracy is useful as a signal about scoping discipline; the moment missing a sprint commitment triggers consequences, estimates pad and the metric reads a comfortable, meaningless 95%.
- Dashboard-first programs. Buying a metrics tool before deciding what questions leadership will act on produces a wall of charts nobody reads. The tool is the last purchase, not the first.
The common thread is trust. A measurement program engineers perceive as surveillance produces corrupted data before it produces any insight — the fastest-degrading asset in the whole system is honest incident reporting, and it degrades the day metrics get attached to individual performance reviews.
What changes when AI writes a share of the code
AI-assisted development bends several classic metrics and adds a new measurement requirement: provenance. Aggregate numbers can look healthy while AI-authored code fails at twice the human baseline rate, so PRs need labeling — human, AI-assisted, agent-authored — from day one; retrofitting provenance is close to impossible.
Three specific effects to design for:
- Activity metrics invert. Code volume becomes nearly free to produce, so volume growth turns from a throughput signal into a risk flag for review load and future maintenance cost.
- The bottleneck relocates to review and verification. AI compresses authoring time; a portfolio that only watches authoring speed will report success while the review queue silently absorbs the gain. Watch cycle time by stage, and treat rising review time as the displaced constraint — the improvement levers, ranked by payoff, are in how to improve software delivery cycle time.
- Quality counterweights become non-negotiable. DORA's research has associated rising AI adoption with measurable delivery-stability decline when the surrounding system is weak. Segment change failure rate and rework by provenance so the effect is isolated rather than inferred.
We cover the instrumentation mechanics in our guide to DORA metrics for AI-assisted software teams, the full AI-era measurement stack — perception gaps, utilization layers, agent-specific metrics — in the field guide on how to measure AI developer productivity, and which AI-specific metrics to report at board, org, and team altitude in our scorecard of AI productivity metrics for engineering leaders. If your organization is auditing what its existing AI licenses actually return, start instead with the audit framework in AI coding tools ROI.
From metrics to money: the executive translation
Engineering productivity metrics earn their keep when they translate into the currency the rest of the business uses. The bridge is cost per delivered outcome: engineering cost for the period divided by production outcomes shipped in the period. A 50-engineer organization at $2.25M per quarter shipping 600 production changes runs at $3,750 per change; every durable improvement in lead time, review flow, or rework shows up in that number, and every regression does too.
This is the framing that survives a finance review — trend lines on cycle time are engineering telemetry, while a falling cost per outcome is a business result. The full translation layer — turning each DORA metric into a dollar figure, at initiative, delivery-system, and portfolio level — is in our guide to software delivery ROI; the AI-specific method, including baselines, a worked example, and the sensitivity analysis a CFO will ask for, is in the ROI measurement pillar; and the presentation layer — structuring the numbers into a fundable proposal — is covered in how to build the business case for AI engineering. For the initiative-level question — whether a specific platform, DevEx, or tooling investment paid back, and how to convert reclaimed hours into dollars a CFO will accept — see developer productivity ROI.
Rolling out a metrics program in 90 days
- Days 1–15 — Decide the questions, then the metrics. Pick the four starter metrics (lead time, change failure rate, investment profile, experience survey) and write one-line definitions for each. Publish the definitions to every team measured, with the explicit commitment that data is read at team level and never feeds individual reviews.
- Days 16–30 — Instrument systems of record. Connect the git provider, CI/CD, and incident tooling. Resist manual data entry anywhere; if a metric needs a spreadsheet, drop the metric.
- Days 31–60 — Baseline quietly. Collect without reacting. Early numbers reflect instrumentation quirks as much as reality, and reacting to week-two data teaches teams the program is a gotcha.
- Days 61–90 — First read and first action. Review the baseline with engineering leadership, pick the one constraint the data exposes (typically review pickup time or WIP), and run one improvement experiment against it. A metrics program that produces one acted-on insight per quarter is succeeding; one that produces forty charts is not.
From there, operate on a cadence: leading indicators weekly, conclusions quarterly, portfolio review twice a year. If freed capacity is the goal — shipping the roadmap items that never make it above the line — the same measurement discipline tells you whether it's working; that playbook is in how to reduce an engineering backlog without hiring.
FAQ
How do you measure engineering productivity?
Measure the delivery system, not individuals: instrument flow metrics (lead time, cycle time by stage, deployment frequency), pair them with quality counterweights (change failure rate, defect escape, rework), track where capacity goes (investment profile), and corroborate with a recurring developer experience survey. Read everything at team level against the team's own history.
What are the four DORA metrics?
Deployment frequency, lead time for changes, change failure rate, and failed-deployment recovery time. The first two measure throughput, the second two stability, and DORA's research treats them as a paired system: a throughput gain only counts if stability held over the same window.
What is the difference between DORA, SPACE, and DX Core 4?
DORA prescribes four benchmarkable delivery-outcome metrics; SPACE is a five-dimension framework arguing productivity must be measured across satisfaction, performance, activity, communication, and efficiency — but names no specific metrics; DX Core 4 is a prescriptive synthesis of both (plus DevEx) organized into speed, effectiveness, quality, and business impact. Start with DORA, add SPACE's survey dimensions for the "why," and adopt Core 4 when you need one unified scorecard.
Is velocity a good measure of engineering productivity?
No — not across teams. Story points are team-relative estimates, so comparing velocity between teams is arithmetic on incompatible units, and setting velocity targets inflates estimates rather than output. Velocity remains useful inside a single team as a planning aid.
Should you measure individual developer productivity?
Only in anonymized, team-level aggregate. Individual rankings corrupt the data (people optimize the scored number), penalize the collaborative work that makes teams fast, and misread the system — individual speedups pool at shared bottlenecks like code review. The practitioner consensus after the 2023 McKinsey debate is that individual activity scoring does more organizational damage than the visibility is worth.
What is a good lead time for changes?
DORA's benchmark tiers put high performers at under a day from commit to production and top performers at under an hour, but the trend matters more than the tier: a team moving from two weeks to three days has improved more meaningfully than a team static at four hours. Benchmark against your own baseline first and industry tiers second.
How does AI change engineering productivity metrics?
Three ways: volume metrics (lines of code, commit counts) become nearly free to inflate and stop discriminating; the delivery bottleneck moves from authoring to review and verification; and provenance segmentation — labeling human, AI-assisted, and agent-authored work — becomes required to isolate AI's real effect on quality and speed.
Conclusion: metrics locate the constraint — then the work starts
A working engineering productivity metrics program is small, systemic, and paired: a dozen metrics at most, read at team level, every speed measure next to its quality counterweight, refreshed on a quarterly cadence. The frameworks are converging tools for the same job — DORA for outcomes, SPACE for dimensions, DX Core 4 for the unified scorecard — and all of them locate constraints without removing them. The removing is engineering leadership, and increasingly it involves deciding where AI genuinely helps your delivery system and where it just inflates the counters.
If you want an outside read on where your delivery system stands — including whether your current metrics would detect AI's effect on it at all — start with the AI Readiness Diagnostic, or see how we instrument and prove engineering outcomes inside delivery engagements on our AI software engineering ROI services page.
Find your highest-value path to agentic delivery.
Map your readiness, delivery constraints, and first 90-day opportunity with the Snowman Labs AI Readiness Diagnostic.