AI Productivity Metrics for Engineering Leaders: A Scorecard
The AI productivity metrics engineering leaders should track at board, org, and team altitude — plus the vanity metrics to drop and a reporting cadence.
 By Danilo Brizola
AI productivity metrics for engineering leaders fall into three families — adoption (who is using AI, how deeply), impact (what changed in delivery speed and quality), and cost (what each gain costs) — and the single most common failure is reporting all of them, to everyone, at once. The metric that helps an engineering manager coach a team is noise in a board deck; the number a board needs is too aggregated to run a team on. This article gives you a scorecard: twelve metrics organized by altitude — board, organization, and team — the vanity metrics to remove from your deck, and the reporting cadence that turns the data into an answer to the question every CEO is now asking: "What are we actually getting from AI?"
This is the metric-selection-and-reporting layer of the problem. If you need the measurement methodology underneath it, start with our field guide to measuring AI developer productivity; if you need to prove causation, use the study designs in measuring the impact of AI on software teams.
Why AI productivity metrics need their own scorecard
Traditional engineering dashboards assume humans write the code, so usage and output move together. Under AI they decouple — which is exactly what the industry data shows.
Faros AI's research across thousands of teams found that roughly 75% of engineers use AI tools, yet most organizations see no measurable performance gains. DX's analysis of 400+ companies found developers self-report saving about 3.9 hours per week, while median pull-request throughput rose only about 8% — against a 65% increase in AI tool usage. And in METR's randomized controlled trial, experienced open-source developers were 19% slower with AI assistance on their own mature codebases — while believing they had been about 20% faster.
Three lessons for the scorecard follow directly:
- Adoption is not impact. Usage numbers tell you whether the tools are being tried, not whether delivery improved. They belong on the scorecard, but never as the headline.
- Self-reported gains overstate real gains. Perceived time savings are a sentiment signal, not a delivery metric. Pair every survey number with system data.
- Speed without quality is a liability. DORA's AI research has consistently found AI adoption improving individual throughput while putting downward pressure on delivery stability. Every speed metric needs a quality counterweight on the same page.
The three questions your AI scorecard must answer
Every credible framework in the market — DX's utilization/impact/cost layers, LinearB's throughput/quality/adoption model, Faros's GAINS dimensions — converges on the same three questions:
| Question | Metric family | What it tells you |
|---|---|---|
| Are we actually using AI? | Adoption | Whether the investment is being exercised — depth, not just breadth |
| Is delivery measurably better? | Impact | Whether speed and quality moved against a pre-AI baseline |
| At what price? | Cost | Whether the gains justify the spend, seat by seat and agent by agent |
The families are sequential. Impact numbers are meaningless before adoption matures (measuring too early is one of the classic mistakes), and cost numbers are meaningless without impact numbers to divide by. If your rollout is younger than a quarter, report adoption honestly and label impact "baseline period" rather than torturing noise into a trend — the 90-day measurement plan in our ROI pillar sequences this properly.
The scorecard: twelve AI productivity metrics by altitude
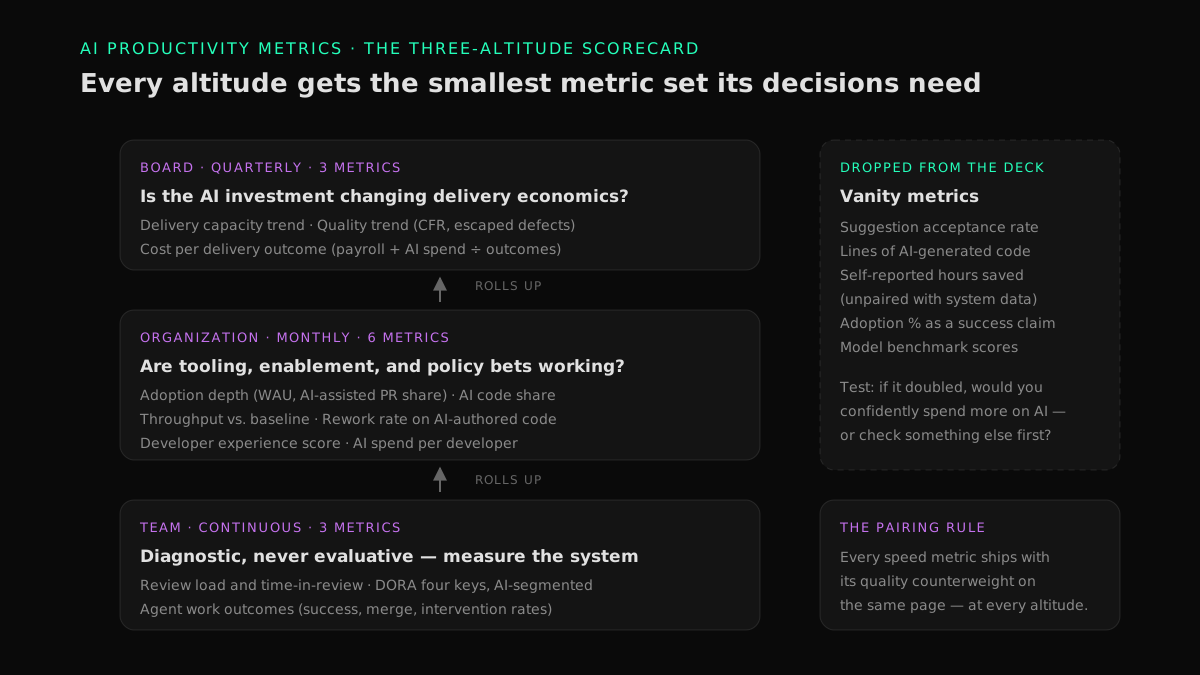
The selection principle: every altitude gets the smallest set of metrics that supports the decisions made at that altitude. Boards allocate capital. Organization leaders allocate tooling, enablement, and policy. Team leaders coach people and fix workflows. A metric that doesn't feed a decision at that level doesn't belong at that level.
Board altitude: three numbers, with trend lines
The board doesn't need DORA metrics or acceptance rates. It needs to know whether the AI investment is changing delivery economics.
| # | Metric | Definition | Healthy signal |
|---|---|---|---|
| 1 | Delivery capacity trend | Throughput of shipped, working outcomes (features, epics) per quarter vs. pre-AI baseline | Rising against a flat or shrinking headcount line |
| 2 | Quality trend | Change failure rate and escaped-defect trend over the same period | Flat or improving while capacity rises |
| 3 | Cost per delivery outcome | Fully loaded engineering cost (salaries + AI spend) ÷ outcomes shipped | Falling quarter over quarter |
Present them together, always. Capacity up with quality down is not a win — it's deferred rework, and boards should see the tension rather than a cherry-picked speed story. For the dollars-and-cents machinery behind metric 3, see software delivery ROI.
Organization altitude: the CTO/VP operating view
| # | Metric | Definition | Watch for |
|---|---|---|---|
| 4 | Adoption depth | Weekly active AI users ÷ licensed seats, and % of PRs that are AI-assisted | Plateaus at 60–70% WAU are normal; a long tail of dormant seats is budget leak |
| 5 | AI code share | % of merged code that is AI-authored (assistant- and agent-generated, tracked separately) | Rising share with stable quality; a governance input, not a target |
| 6 | Throughput vs. baseline | PR or epic throughput against the pre-rollout baseline, cohort-adjusted | DX's data shows daily AI users at 2.4 PRs/week vs. 1.5 for non-users — cohort gaps like this are your enablement roadmap |
| 7 | Rework rate on AI-authored code | % of AI-authored code rewritten or reverted within 30 days | The earliest hard signal that speed is being borrowed from quality |
| 8 | Developer experience score | Survey-based DevEx/DXI trend, segmented by AI usage cohort | Falling DevEx among heavy AI users predicts churn of your best adopters |
| 9 | AI spend per developer | All-in tool spend (seats + metered usage) ÷ active developer | Benchmark against the per-tool audit in AI coding tools ROI |
This is the altitude where most scorecards live, and six metrics is a deliberate ceiling. If a number doesn't change a tooling, policy, or enablement decision this quarter, it goes in the appendix, not the dashboard.
Team altitude: what engineering managers actually run on
| # | Metric | Definition | Why it matters here |
|---|---|---|---|
| 10 | Review load and time-in-review | PRs waiting on review, review turnaround time | AI moves the bottleneck from writing code to reviewing it; this is where the gain stalls |
| 11 | DORA four keys, AI-segmented | Lead time, deploy frequency, change failure rate, MTTR — split human vs. AI-assisted work | The four keys stay valid under AI if you segment them — full treatment in DORA metrics for AI-assisted teams |
| 12 | Agent work outcomes | For autonomous agents: task success rate, merged-PR rate, human-intervention rate per delegated task | Agents are workload, not headcount — measure them like a delivery channel, not a developer |
Team-level metrics are diagnostic, never evaluative. The moment metric 10 or 11 shows up in a performance review, it will be gamed, and your whole scorecard inherits the distortion — the anti-gaming rule is to keep team metrics about the system (queues, cycle times, failure rates), not the individual.
Vanity metrics: what to remove from the deck
Every metric below is common in AI dashboards, and each one misleads at leadership altitude:
- Suggestion acceptance rate. Vendors headline it, but accepting a suggestion says nothing about whether it survived review, merged, or shipped. Use it, at most, as a team-level tool-tuning signal.
- Lines of AI-generated code. Volume is not value. AI makes code cheaper to produce, which makes line counts less meaningful than they already were — and code-quality research such as GitClear's longitudinal analysis links AI-era volume growth to rising duplication and churn.
- Self-reported hours saved, unpaired. Useful as sentiment, dangerous as a headline: METR's trial showed perception can run 40 points ahead of reality. Report it only next to system-measured throughput.
- Adoption percentage as a success claim. "92% of our engineers use AI" is a procurement fact, not a productivity result. Faros's "productivity paradox" finding — high adoption, no measurable gains — is precisely why boards should be suspicious of adoption-led stories.
- Model benchmark scores. Which model your vendor uses is an input. Your scorecard measures outcomes in your delivery system.
A simple test for any candidate metric: if this number doubled, would you confidently spend more on AI — or would you have to check something else first? If you'd have to check something else, report that something else.
Agent-era additions: measuring delegated work
Autonomous coding agents (Devin, Claude Code, Codex-style systems) break the per-developer frame that assistant-era metrics assume, because work is delegated, not assisted. Three additions keep the scorecard coherent as agent share grows:
- Agent-authored share of merged code — tracked separately from assistant-authored share (metric 5), because the review and governance regimes differ.
- Agent cost per merged PR — metered agent spend ÷ merged agent PRs. This is the number that makes agent ROI comparable to human-hour economics, and it belongs in the metric 9 roll-up.
- Human-intervention rate — the share of delegated tasks needing substantive human rescue. Falling intervention at stable quality is the cleanest signal that agent adoption is maturing.
Sandboxed execution, scoped credentials, and human review gates are prerequisites for trusting these numbers at all — an agent metric on top of an ungoverned pipeline measures speed toward incidents. Our work as an enablement partner rolling out agents inside enterprise teams consistently starts with the governance layer before the measurement layer.
Reporting cadence: from dashboard to narrative
A scorecard nobody reads on a rhythm is a data warehouse. The cadence that works:
- Monthly — engineering leadership review (metrics 4–12). Working session, not a readout: every red metric leaves with an owner and an experiment. Agent metrics reviewed alongside human-cohort metrics.
- Quarterly — executive/board readout (metrics 1–3). One slide, three trend lines, one narrative sentence per line. Lead with the decision, not the data: "Capacity is up 14% at flat quality and 6% lower cost per outcome; we're expanding agent delegation to two more teams."
- Annually — re-baseline. Models, tools, and team composition change enough each year that trends against a stale baseline flatter or slander you. Reset the denominators.
The narrative discipline matters more than the tooling. When the CEO asks what the company is getting from AI, the answer is metrics 1–3 in one sentence — never a tour of the dashboard.
Rolling it out without boiling the ocean
You don't need all twelve metrics on day one. The sequence that avoids the classic failure modes:
- Weeks 1–4: baseline. Capture pre-AI (or current-state) throughput, quality, and cost numbers before changing anything. No baseline, no impact claims — ever.
- Weeks 5–8: adoption layer. Instrument seats, WAU, and AI-assisted-PR share from tool APIs and git metadata.
- Weeks 9–12: impact layer. Turn on throughput-vs-baseline, rework rate, and segmented DORA. Run your first monthly review.
- Quarter 2: cost layer and board slide. With two quarters of trend, compute cost per outcome and ship the first three-line board readout.
This compresses the measurement program in our ROI pillar into scorecard form; the pillar has the full worked example, and the broader engineering productivity metrics guide covers the non-AI metrics foundation this sits on.
FAQ
What are AI productivity metrics?
AI productivity metrics quantify how AI tools and agents change software delivery. They span three families: adoption metrics (active users, share of AI-assisted PRs), impact metrics (throughput vs. baseline, rework rate, change failure rate, developer experience), and cost metrics (AI spend per developer, cost per delivery outcome). No single family is sufficient — adoption without impact is spend, and impact without cost is an unfinished ROI story.
How do you measure AI productivity in software engineering?
Establish a pre-AI baseline, instrument adoption from tool APIs and git metadata, then compare delivery metrics (throughput, cycle time, change failure rate, rework) against that baseline — ideally cohort-segmented, comparing heavy AI users with light users on similar work. Triangulate system data with developer surveys, and never rely on self-reported time savings alone.
Which AI metrics should a CTO report to the board?
Three, as trend lines: delivery capacity vs. baseline, quality trend (change failure rate or escaped defects) over the same period, and cost per delivery outcome including AI spend. Everything else — adoption rates, acceptance rates, DORA details — is operating data for the engineering organization, not the board.
Is AI code acceptance rate a good metric?
Not at leadership altitude. Acceptance rate measures whether developers keep suggestions, not whether accepted code survives review, merges, or ships value — and it's trivially inflated by accept-then-rewrite behavior. Treat it as a team-level tool-configuration signal and keep it off executive dashboards.
How much productivity gain should we expect from AI coding tools?
Calibrate expectations to measured medians, not vendor claims: across DX's 400+ company dataset, median PR throughput gains sit around 5–15%, with stronger gains concentrated among daily users. Controlled-task studies show larger speedups on greenfield work and near-zero or negative effects on complex, mature codebases. Plan the business case on the median and treat outlier gains as upside.
What is a good AI adoption rate for an engineering team?
Weekly active usage of 60–70% of licensed seats is where even leading organizations plateau, so treat that band as strong. More important than the headline rate is depth (daily vs. occasional use) and the dormant-seat tail — seats unused for 60+ days are budget to reclaim in your next license negotiation.
How is measuring agents different from measuring AI assistants?
Assistants amplify a developer, so per-developer metrics still work. Agents receive work, so the unit of analysis becomes the delegated task: success rate, merged-PR rate, human-intervention rate, and cost per merged PR. Track agent-authored code separately from assistant-authored code so quality regressions can be traced to the right governance regime.
Conclusion: report decisions, not dashboards
The scorecard above is deliberately small: three numbers for the board, six for the organization, three for the teams doing the work — each chosen because a specific decision depends on it, with vanity metrics removed precisely because no decision does. Build the baseline first, pair every speed number with its quality counterweight, and rehearse the three-sentence answer to "what are we getting from AI?" before the quarter ends.
If you want that scorecard stood up against your own delivery data — baseline included — start with our AI readiness assessment, or see how we instrument and prove engineering outcomes inside delivery engagements on our AI software engineering ROI services page. Across 400+ delivered projects we've found the measurement layer is what separates AI programs that compound from those that stall at the pilot.
Find your highest-value path to agentic delivery.
Map your readiness, delivery constraints, and first 90-day opportunity with the Snowman Labs AI Readiness Diagnostic.