How to Measure the Impact of AI on Software Teams
How to measure the impact of AI on software teams: baselines, cohort study designs, counterweight metrics, and a 90-day plan that separates signal from hype.
 By Danilo Brizola
To measure the impact of AI on software teams, you need three things most organizations skip: a pre-rollout baseline, a comparison design that isolates AI from everything else that changed, and counterweight metrics that catch quality erosion behind the speed gains. Self-reports alone will mislead you — in a randomized controlled trial by METR, experienced developers using AI tools completed tasks 19% slower while estimating afterward that AI had made them 20% faster. This guide is for engineering leaders who need to know — with evidence, not vibes — whether AI is actually changing what their teams ship. By the end you will be able to design a team-level impact study, pick the right comparison method, and read the results without fooling yourself.
Why the impact of AI on software teams is hard to measure
The core problem is a gap between perception and delivery. Developers consistently report large time savings — DX's benchmark of 400+ companies found developers saving a self-reported 3.9 hours per week — yet the same dataset shows median pull-request throughput up only about 8%, with most organizations landing in a 5–15% range. Individual gains are real, but they get absorbed before they reach team-level delivery: code review queues, integration bottlenecks, unclear requirements, and deployment friction don't move just because code got written faster.
Three findings frame the measurement challenge:
- Perception is not evidence. The METR study — 16 experienced open-source developers, 246 real tasks on mature repositories, randomized AI-allowed vs. AI-disallowed — found a 19% slowdown where participants perceived a 20% speedup. If seasoned engineers misjudge their own productivity by ~40 percentage points, a satisfaction survey cannot be your only instrument.
- AI amplifies what's already there. The 2025 DORA report — with AI adoption at 90% of respondents — concludes that AI acts as an amplifier: it magnifies the strengths of well-run organizations and the dysfunctions of struggling ones. It also found AI adoption associated with higher throughput and higher instability. Your measurement has to capture both sides.
- Team impact ≠ sum of individual impact. A developer who codes 30% faster inside a team whose constraint is review latency changes the team's delivery rate by roughly zero. That is why this article measures at the team level; for the individual layer, see our guide to measuring AI developer productivity.
Adoption, impact, and cost are three different questions
A useful convention — popularized by DX's AI Measurement Framework — is to separate measurement into three layers. Teams that conflate them end up celebrating adoption numbers as if they were outcomes.
| Layer | Question it answers | Example team-level metrics |
|---|---|---|
| Utilization | Are teams actually using AI? | % of active developers using AI daily/weekly, % of PRs with AI assistance, % of code AI-authored |
| Impact | Is delivery performance improving? | PR/feature throughput, cycle time, change failure rate, rework rate, defect escape rate |
| Cost | Is the spend justified? | AI spend per developer, net time gain per developer, cost per delivered outcome |
The discipline this buys you: adoption is a precondition for impact, never proof of it. "93% of our engineers use Copilot" is a utilization fact. Whether cycle time, quality, or roadmap delivery changed is a separate empirical question — and per the DX data, the honest industry-wide answer so far is "modestly, with wide variance." If you need help choosing the delivery metrics themselves, our rundown of engineering productivity metrics worth tracking covers the twelve that survive contact with AI.
Set the team baseline before you need it
A baseline is the single highest-leverage measurement act, and it is time-sensitive: every month of AI usage without one erodes your ability to attribute change. Capture at least four weeks — ideally a full quarter — of:
- Throughput: merged PRs or completed work items per team per week (not per individual)
- Cycle time: first commit to production, with stage breakdowns (coding, review wait, review, deploy) — our guide to improving software delivery cycle time explains how to instrument each stage
- Stability: change failure rate and mean time to recovery, per the DORA four keys adapted for AI-assisted teams
- Quality: defect escape rate, rework rate (code substantially rewritten within 30 days), review-comment density
- Experience: a short developer-experience survey (satisfaction, confidence in changes, perceived friction)
Already rolled AI out without a baseline? You still have options: reconstruct one from historical Git/CI data (most of the metrics above are computable retroactively), or lean on the comparison designs below that don't require a clean "before."
Choose a comparison design: the hierarchy of evidence
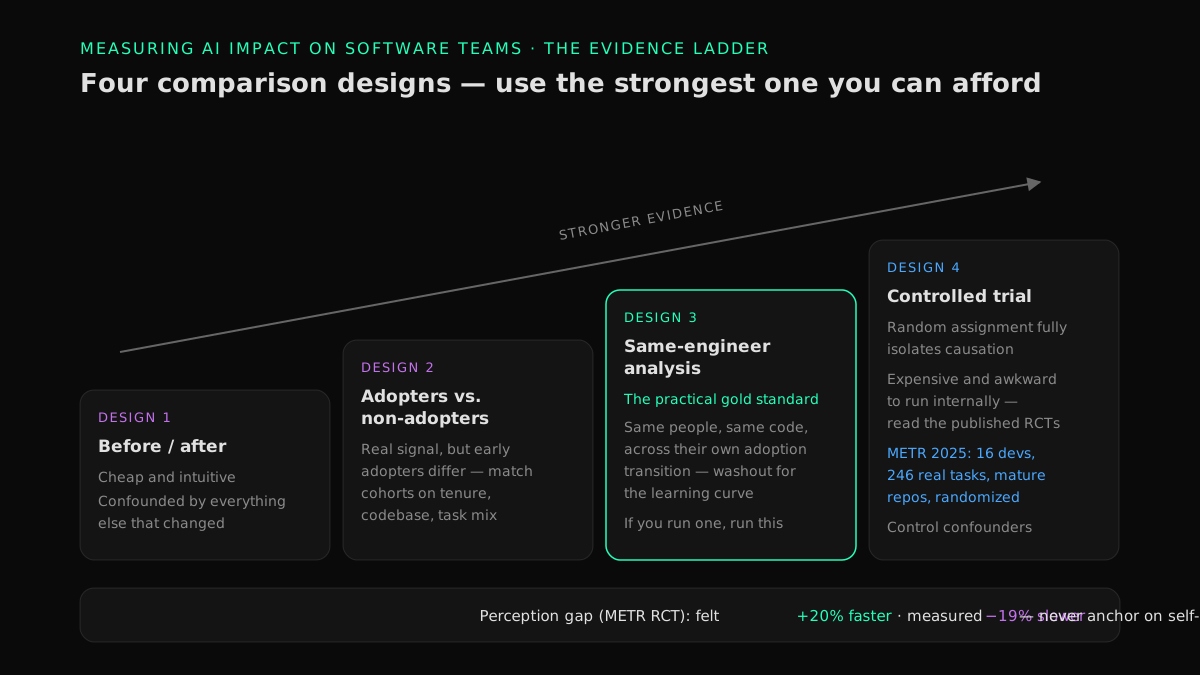
Measuring AI impact is a study-design problem, not a dashboard problem. The designs below run from weakest to strongest. Use the strongest one your organization can afford — and be honest in the write-up about which one you used.
1. Before/after comparison (weakest)
Compare team metrics for the quarter before rollout against the quarter after. Cheap, intuitive — and confounded by everything else that changed: headcount, product cycle, holidays, a re-org, a new framework. Acceptable as a first signal, never as a conclusion.
2. Adopter vs. non-adopter cohorts
Compare teams (or engineers) who use AI heavily against those who don't. The DX benchmarks show daily AI users merging 2.4 PRs per week vs. 1.5 for non-users — a real and useful signal. The catch is selection bias: early adopters tend to be more motivated, more senior, or staffed on greenfield work. Cohort differences bundle the tool with the kind of person who picked it up first. Reduce the bias by matching cohorts on tenure, codebase, and task mix before comparing.
3. Same-engineer analysis (the practical gold standard)
Track the same engineers on the same codebase across their own transition from non-use to regular use, with a washout period for the learning curve. This holds the person, the code, and most of the environment constant. DX reports a major financial-services company measuring a 30% PR-throughput increase this way — a far more defensible number than any cross-cohort delta. If you run one design, run this one.
4. Controlled trial (strongest, rarely worth it internally)
Randomly assign comparable tasks or teams to AI-allowed and AI-disallowed conditions, as METR did. This is the only design that fully isolates causation, and it is expensive and organizationally awkward. Most enterprises should read the published RCTs rather than run their own — and let the same-engineer design carry their internal evidence.
Confounders to control for in any design
- Learning curve (the J-curve): productivity typically dips for 4–8 weeks after adoption. Evaluating during the dip understates impact; evaluating only enthusiast early adopters overstates it.
- Task mix: AI helps more on boilerplate, tests, and greenfield code than on gnarly legacy changes. If the pilot team got the greenfield project, the comparison is contaminated. (METR deliberately tested mature, high-context repositories — one reason its result surprised people.)
- Hawthorne effect: teams that know they're being measured behave differently. Prefer metrics computed from systems of record over ad-hoc self-tracking.
- Seasonality and roadmap phase: never compare a crunch quarter against a planning quarter.
The team-level metric portfolio: pair every speed metric with a counterweight
AI's failure mode is trading visible speed for invisible quality debt — the 2025 DORA finding of throughput up, instability up, in one line. The defense is structural: every "go faster" metric in your portfolio gets a paired "did it hold" metric you read at the same time.
| Dimension | Speed signal | Counterweight |
|---|---|---|
| Delivery | PR/feature throughput | Rework rate (rewritten within 30 days) |
| Flow | Cycle time | Review-wait time (is review now the bottleneck?) |
| Release | Deployment frequency | Change failure rate, MTTR |
| Code | AI-assisted share of changes | Defect escape rate, maintainability perception |
| People | Self-reported time savings | DevEx score, change confidence, on-call load |
Two portfolio rules. First, read counterweights with the same seriousness as the headline: a 20% throughput gain with a rising change failure rate is not a win — it's a loan. Second, translate nothing into dollars at this stage; impact measurement and financial modeling are separate steps, and our pillar on measuring the ROI of AI in software engineering covers the conversion — cost per outcome, CFO-ready framing — once your deltas are trustworthy.
Triangulate three data sources — never just one
The organizations that measure AI credibly — Pragmatic Engineer's survey of how 18 tech companies do it is the best public inventory — converge on the same triangulation:
- Systems data (Git, CI/CD, incident tooling, AI-tool APIs): objective, continuous, immune to perception bias — but blind to why.
- Periodic surveys (quarterly DevEx assessments): catch maintainability concerns, trust, and friction that telemetry can't see. Monzo weighs developer sentiment heavily; Dropbox tracks CSAT with AI tools alongside throughput and change failure rate.
- Experience sampling (short in-the-moment prompts during key workflows): captures ground truth about specific interactions without months of recall bias.
The METR result is the standing argument for why the first source must anchor the other two: self-reports drift optimistic under AI. But telemetry alone would miss what Google and GitHub both watch closely — whether AI-generated code that ships behaves differently in production, which is as much a review-and-governance question as a measurement one. We cover that operational side in production-safe AI code and why runtime context matters.
Measuring agents changes the unit of analysis
Assistants accelerate a human; autonomous agents (Devin, Codex-style systems) produce work themselves. That shifts what you count: agent-authored PRs need their own labels in your version-control data, because blending them into team averages hides both their value and their risk. Track per agent, per team:
- Merge rate of agent-authored PRs, and time-to-merge vs. human baseline
- Human-edit rate: how much agent output gets substantially modified before merge
- Escaped defects per agent-authored change, read against the human rate
- Task completion cost: agent compute + human review time per merged change
In our enablement work as an official Cognition partner — training enterprise engineering teams alongside Cognition's Forward Deployed Engineers to get real value from Devin — instrumenting agent-authored work separately is one of the first things we set up, precisely because it makes the impact conversation concrete within weeks instead of quarters. The same separation logic applies whether the agent is Devin, an internal fleet, or anything in between; our guide to measuring AI developer productivity goes deeper on agent-specific telemetry.
A 90-day team impact study you can actually run
This plan produces a defensible team-level read without research staff. It complements — not duplicates — the ROI measurement plan in the pillar article: this one establishes whether and where AI moves your teams; the pillar converts that into money.
Weeks 1–4 — Baseline and instrumentation. Compute the metric portfolio above from historical data (one quarter back if available). Stand up the three-layer dashboard: utilization, impact, cost. Run the first DevEx survey. Pick the comparison design — default to same-engineer analysis if AI is mid-rollout, matched cohorts if it's already everywhere.
Weeks 5–10 — Structured observation. Let teams work. Resist mid-study tooling changes — every change resets attribution. Tag agent-authored work from day one. Run one round of experience sampling on the workflows where you expect the most impact (test writing, code review prep, migration work — the areas where DX's benchmarks show the clearest gains).
Weeks 11–13 — Read-out and decision. Compute deltas with counterweights side by side. Check confounders explicitly in the write-up: learning-curve phase, task mix, cohort composition. Then make one of three calls per team: scale (impact clear, quality holding), fix the constraint (individual gains real but absorbed — usually at review or deployment; that's a delivery-system problem, not an AI problem), or investigate (quality counterweights moving the wrong way).
The "fix the constraint" branch is the most common outcome in practice, and it's good news: it means the AI investment is sound and the bottleneck is now visible enough to attack. That system-level work — measured against the same portfolio — is how the ROI of the whole investment eventually clears the bar.
FAQ
How do you measure the impact of AI on software development teams?
Establish a pre-rollout baseline of team delivery metrics (throughput, cycle time, change failure rate, rework rate), then measure change using a comparison design that controls for confounders — same-engineer analysis is the most practical rigorous option. Track adoption, impact, and cost as separate layers, and pair every speed metric with a quality counterweight.
What metrics show whether AI coding tools are actually working?
At the team level: PR or feature throughput, cycle time, change failure rate, defect escape rate, and rework rate, read together. Utilization metrics (active users, AI-assisted PR share) show whether the tools are being used — not whether they're working. Acceptance rate is a product signal for tool vendors, not an impact metric.
Why don't AI time savings show up in delivery throughput?
Because individual coding speed is rarely the team's constraint. Saved hours get absorbed by review queues, integration work, unclear requirements, and meetings — and some are reinvested in untracked work like deeper testing or refactoring. Industry data shows ~4 self-reported hours saved per developer per week against a median throughput gain of roughly 8%.
How long should you wait before measuring AI impact?
Expect a 4–8 week learning-curve dip after rollout; measuring during it understates real impact. A practical rhythm is: baseline before rollout, first directional read at 90 days, and a decision-grade read after two full quarters of stable usage.
Should we compare AI users with non-users on the same team?
With caution. Adopter vs. non-adopter comparisons carry selection bias — early adopters differ systematically in seniority, motivation, and task mix. Match cohorts on those variables, or prefer same-engineer analysis, which tracks the same people across their own adoption transition.
Does AI-generated code cause more defects?
It can. The 2025 DORA report links AI adoption to higher throughput and higher instability, and some organizations in DX's dataset saw defect rates rise by nearly two percentage points. The outcome depends on review discipline and governance more than on the tool — which is why change failure rate and rework rate belong in every AI measurement portfolio.
Conclusion: run a study, not a survey
Measuring the impact of AI on software teams comes down to four decisions: baseline early, separate adoption from impact from cost, pick the strongest comparison design you can afford, and never read a speed metric without its quality counterweight. Do that and you'll know — within a quarter — which teams AI is genuinely accelerating, where the gains are being absorbed by your delivery system, and what to fix next.
If you want that measurement designed against your own delivery system rather than in the abstract, start with the AI Readiness Diagnostic — a structured baseline of where your organization stands before AI amplifies it — or see how we build measurement into delivery engagements on our AI software engineering ROI services page.
Find your highest-value path to agentic delivery.
Map your readiness, delivery constraints, and first 90-day opportunity with the Snowman Labs AI Readiness Diagnostic.