Developer Productivity ROI: From Hours Saved to Dollars
How to calculate developer productivity ROI: fully loaded engineering costs, an honest hours-to-dollars conversion, benchmarks, and a worked example.
 By Danilo Brizola
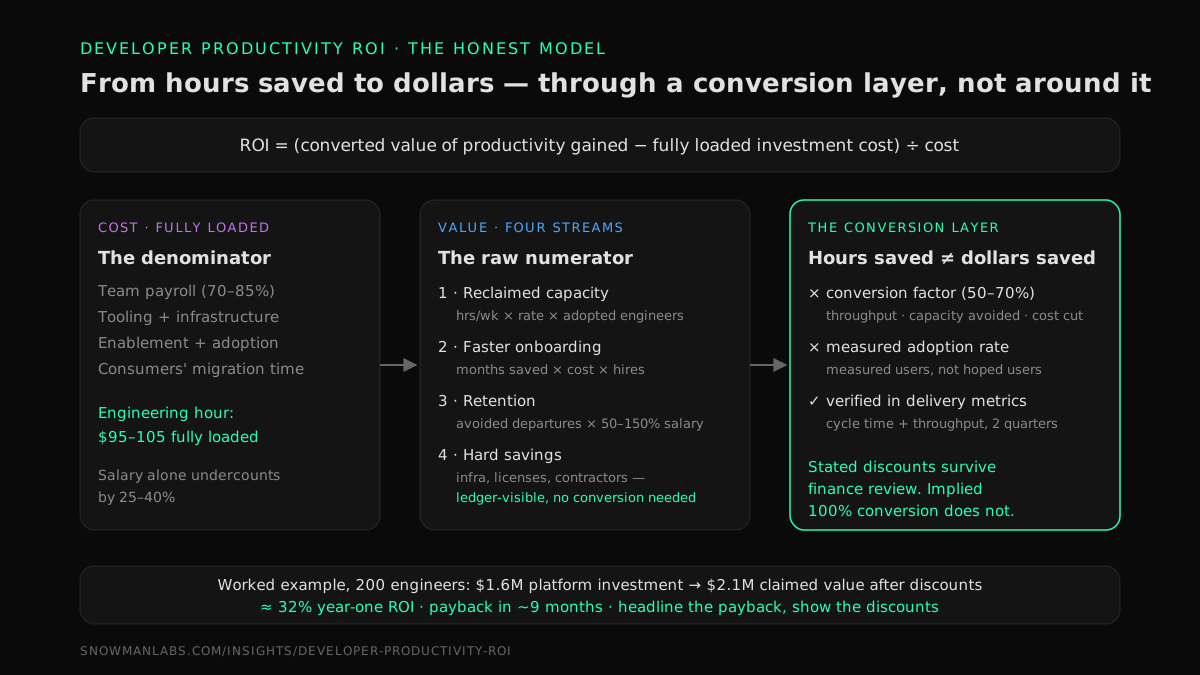
Developer productivity ROI is the financial return on investments made to make engineers more productive — platform teams, developer experience programs, CI/CD improvements, internal developer portals, AI tooling — calculated as (dollar value of the productivity gained − fully loaded cost of the investment) ÷ cost. The formula is trivial. What separates a credible number from a vendor slide is the conversion step in the middle: turning hours reclaimed into dollars a CFO will accept.
This guide is for CIOs, CTOs, and VPs of Engineering who fund productivity work — a platform team, a DevEx initiative, a tooling consolidation — and have to defend that line item. It covers what an engineering hour actually costs, the four ways productivity investments return money, the conversion problem that most published ROI math skips, honest benchmarks, and a worked example you can rebuild with your own inputs.
What developer productivity ROI actually measures
Developer productivity ROI measures whether a specific investment in how engineers work returned more than it cost. It is initiative-level math: one platform team, one DevEx program, one tooling decision — each with its own cost, its own measured effect, and its own return.
That scope matters, because it is easy to confuse with two adjacent questions that need different math:
- Is our delivery system as a whole worth what it costs? That is software delivery ROI — the return on the entire function, measured through cost per delivered outcome.
- Is AI specifically paying off in engineering? That is the subject of our pillar on how to measure ROI from AI in software engineering, with its own baseline-first methodology.
Developer productivity ROI sits underneath both: it is how you evaluate each individual bet — and, just as important, how you rank the next bet. The category is broader than AI. It includes:
| Investment type | Typical cost shape | Primary value mechanism |
|---|---|---|
| Platform engineering / internal developer platform | Dedicated team (5–15 engineers) + infrastructure | Reclaimed time, faster onboarding, standardization |
| Developer experience (DevEx) program | Program lead + fix backlog capacity | Reclaimed time, retention |
| CI/CD and test infrastructure | Tooling + migration effort | Shorter feedback loops, fewer failed changes |
| AI coding tools and agents | Per-seat licenses + usage/token costs + enablement | Task acceleration, capacity without headcount |
| Tooling consolidation | Negative (it frees budget) | Direct license savings + less context switching |
The reason this measurement is worth doing is the size of the waste it targets. Atlassian's 2024 State of Developer Experience report, surveying 2,150 developers and engineering leaders, found that 69% of developers lose eight or more hours per week to inefficiencies — roughly 20% of their time — and fewer than half believe leadership is aware of it. Twenty percent of an engineering payroll is a large number in any organization. The ROI model is how you decide which slice of that waste is cheapest to buy back.
The denominator: what an engineering hour actually costs
Get the cost side right first, because every value calculation downstream reuses it. Two numbers matter.
1. The fully loaded cost of an engineering hour. Salary alone undercounts by 25–40%. Fully loaded cost adds benefits, payroll taxes, equipment, real estate or remote stipends, and allocated management overhead. A US enterprise engineer at $150,000 base is typically $190,000–$210,000 fully loaded. At ~2,000 nominal working hours a year, that is $95–$105 per hour — before you adjust for the fact that only a fraction of those hours are productive engineering time. McKinsey's research on developer productivity notes that developers at top companies target up to 70% of time on inner-loop work (building, coding, testing); most organizations sit far below that. If only ~60% of paid hours are engineering hours, the effective cost of an hour of engineering is $160–$175. Use the plain fully loaded rate in ROI models — it is defensible and conservative — but know the effective rate when you are sizing the waste.
2. The fully loaded cost of the investment. The same discipline applies to the initiative itself:
- People: the platform or DevEx team's fully loaded payroll — usually 70–85% of total cost.
- Tooling and infrastructure: licenses, compute, vendor contracts. For AI tools, include usage-based and token costs, not just seats — our AI coding tools ROI audit covers why seat price alone understates real cost.
- Enablement and adoption: training, migration effort, documentation, internal marketing. This line is routinely omitted and routinely decisive — an unadopted platform has infinite payback.
- The consumers' time: hours other teams spend migrating onto the new platform or workflow. It is a real cost in the year you incur it.
The numerator: four ways productivity investments return money
Productivity investments return money through four mechanisms. Each converts to dollars differently, and mixing them up is how ROI slides lose credibility.
1. Reclaimed engineering capacity
The core mechanism: the investment removes friction, engineers get hours back, and those hours are worth money. The arithmetic template is the one used across the industry — hours saved per developer per week × fully loaded hourly rate × developers × 52. Platform engineering ROI frameworks use exactly this shape, and survey-calibrated models like DX's Developer Experience Index put a coefficient on it: in DX's research across roughly 40,000 developers, each one-point DXI gain corresponds to about 13 minutes saved per developer per week, around 10 hours a year. Reclaimed capacity is the biggest line in most models — and the one that needs the conversion discount discussed in the next section.
2. Faster onboarding
If a new engineer takes three to six months to reach full contribution, and the platform or documentation investment cuts that meaningfully, the value is (months saved × monthly fully loaded cost × planned hires). Cortex's IDP ROI guidance uses this exact structure, citing a Forrester-measured 20% developer productivity improvement and time-to-first-commit dropping to about a week. This stream is only material if you are actually hiring — at 5+ hires a year it is often the second-largest line; in a hiring freeze it is zero. State which case you are in.
3. Retention and engagement
Replacing an engineer costs somewhere between 50% and 150% of annual salary in recruiting, backfill gap, and ramp time. DevEx research consistently links experience to retention — DX's benchmarks show top-quartile DXI teams score 43% higher on employee engagement than bottom-quartile teams. Model it conservatively: claim a fraction of avoided attrition (for example, one to two avoided departures per 100 engineers per year), state the assumption, and let the CFO discount it. Never make retention the load-bearing line — it is a credible secondary stream, not a primary one.
4. Hard savings
The only stream that needs no conversion: infrastructure cost reductions from standardization, decommissioned duplicate tools, reduced contractor spend, avoided license growth. These are ledger-visible dollars. They are usually the smallest stream — but because they are indisputable, lead with them when credibility matters. If your main goal is cutting spend rather than raising output, that is a different playbook: see how to reduce software development costs without cutting capacity.
The conversion problem: hours saved are not dollars saved
Here is where most developer productivity ROI math fails an audit. The standard model multiplies hours saved by hourly rate and calls the product "value." A CFO will ask the obvious question: did payroll go down, or did output go up? If neither happened, the hours were not converted — they were just moved.
Reclaimed time only becomes ROI through one of three routes:
- Throughput conversion — the reclaimed hours become more shipped roadmap: higher throughput at stable quality, visible in delivery metrics. This is the route to claim, and it is checkable: if you claim 10% capacity back, cycle time and throughput should move within two quarters.
- Capacity avoidance — the team absorbs growth without hiring; value = hires not made. Visible in the headcount plan.
- Cost reduction — rare and morale-expensive; value = actual payroll reduction.
Because conversion is never 100%, apply an explicit discount. Reclaimed fragments get absorbed by meetings, context switching, and Parkinson's law; a defensible model claims 50–70% of measured time savings as converted value and states the discount openly. A stated 60% conversion factor survives finance review; an implied 100% does not.
The second honesty check is adoption. Value scales with the share of engineers actually using the new platform or tool, and business cases habitually assume 80–90% adoption while real internal platforms frequently stall at a fraction of that. Instrument adoption from day one and report value as measured users × measured savings, not all engineers × hoped savings. (The same failure mode dominates AI tooling: measured GitHub Copilot productivity effects — Microsoft/MIT's controlled experiments found roughly 26% more completed tasks among users — only translate to organizational ROI at real adoption and real usage depth.)
A worked example: a platform investment for 200 engineers
A 200-engineer organization stands up a six-person platform team to fix CI, environments, and golden paths. Fully loaded engineer cost: $200,000 ($100/hour).
Cost side (annual):
| Item | Amount |
|---|---|
| Platform team (6 × $200K fully loaded) | $1,200,000 |
| Tooling and infrastructure | $250,000 |
| Enablement + consumer migration time | $150,000 |
| Total investment | $1,600,000 |
Value side (annual, measured after two quarters):
| Stream | Raw math | Claimed |
|---|---|---|
| Reclaimed capacity: 3 hrs/wk × 160 adopted engineers × $100 × 48 wks | $2,304,000 | × 60% conversion = $1,382,000 |
| Onboarding: 1 month faster × $16.7K/month × 24 hires | $400,000 | $400,000 |
| Retention: 2 avoided departures × $150K replacement cost | $300,000 | × 50% attribution = $150,000 |
| Hard savings: decommissioned CI vendor + duplicate tooling | $180,000 | $180,000 |
| Total claimed value | $2,112,000 |
ROI = ($2,112,000 − $1,600,000) ÷ $1,600,000 ≈ 32%, with payback in roughly nine months of run-rate value. Note what made the number conservative: adoption counted at 160 of 200 engineers, a 60% conversion discount, 50% attribution on retention, and 48 productive weeks. An aggressive version of the same inputs — full adoption, no discount — produces "$3.2M value, 100% ROI" and gets torn apart in review. The conservative number is smaller and fundable.
What is a good developer productivity ROI?
Cross-checking published benchmarks against the conservative method above:
- Platform engineering initiatives with real adoption typically land between breakeven and ~250% annual ROI once mature; documented examples cluster around 180–220%. First-year ROI is usually far lower because cost is front-loaded and adoption ramps.
- Vendor-commissioned Forrester TEI studies on DevEx and portal tooling report ranges like 150–430% over three years — treat these as upper bounds produced under favorable assumptions, not planning numbers.
- Payback period is often the better headline than the percentage: 12–24 months is credible for platform work; under 12 months is excellent; a claim under 6 months usually means a cost was omitted.
A useful sanity rule: if your model outputs more than ~3× return in year one, hunt for the missing cost or the unconverted hours before a finance partner does.
Metrics that feed the model
The ROI calculation consumes measurements; it does not replace them. You need three instruments running before and after the investment — the before matters most, because without a frozen baseline every later claim is an anecdote:
- Delivery metrics (DORA: lead time, deployment frequency, change failure rate, recovery time) to verify that reclaimed capacity converted to throughput.
- Experience and time-loss data (surveys on the SPACE dimensions, DXI-style instruments) to measure where hours are lost and reclaimed.
- Adoption telemetry for the specific platform or tool, because value scales with usage.
Choosing and rolling out these instruments is its own discipline — our guides to engineering productivity metrics and measuring AI developer productivity cover the frameworks, the anti-patterns (no individual stack-ranking, no lines of code), and a 90-day rollout plan.
Ranking the portfolio: where the next productivity dollar goes
The most valuable use of developer productivity ROI is comparative. At any moment you have several candidate investments — expand the platform team, buy AI agent capacity, fund a DevEx fix backlog, consolidate tools. Build the same conservative model for each and rank by payback period per dollar at realistic adoption. Three patterns recur:
- Friction removal usually beats acceleration. If engineers lose 20% of their week to broken environments and slow CI, an AI assistant accelerates the 80% while the 20% keeps bleeding. Fix the constraint first — the same logic that governs improving developer productivity with AI: tools multiply a system, and multiplying a broken system yields broken output faster.
- Consolidation funds the rest. Tool-portfolio rationalization is often the only candidate with negative net cost; the freed budget pays for the enablement line the other initiatives need.
- Agentic capacity changes the unit of math. Autonomous coding agents are priced per unit of work rather than per seat, so their ROI computes like contractor spend — cost per completed task vs. fully loaded cost of the same task in-house — not like a productivity multiplier on existing staff. That math, and the governance it requires, is covered in the ROI pillar.
Taking the number to the CFO
Finance evaluates a developer productivity investment like any other line item: cash out, value back, time to recover. Present it that way.
- Lead with payback period, not the ROI percentage — it communicates cash timing and risk in one number.
- Show the discounts. A model that visibly applies adoption rates and a conversion factor reads as engineering rigor; one that doesn't reads as a vendor slide.
- Commit to a checkpoint. Baseline now, re-measure at two quarters, and pre-agree what happens if the movement isn't there. This turns the ROI claim into a managed investment.
- Keep the model alive. The spreadsheet that wins the budget should become the scorecard that reports on it — the same structure we recommend for the AI engineering business case.
This is also where an outside measurement partner earns its fee: an independently built baseline and ROI model carries more weight with finance than one built by the team requesting the budget. That is the core of our software engineering ROI service — instrument, baseline, and report engineering investments in the language a CFO already trusts.
FAQ
How do you calculate developer productivity ROI?
Take the fully loaded annual cost of the investment (team, tooling, enablement, consumers' migration time), measure the value it produced across four streams (reclaimed capacity, faster onboarding, retention, hard savings), apply an explicit conversion discount to the time-based streams, then compute (value − cost) ÷ cost. Report the percentage together with the payback period.
What is the formula for developer productivity?
There is no single formula — productivity is multidimensional. In practice organizations combine delivery metrics (DORA), experience data (SPACE or DXI surveys), and business outcomes. For ROI purposes you don't need a universal productivity number; you need the change in specific measures attributable to the investment, converted to dollars.
How much does a developer hour cost?
For a US enterprise engineer, typically $95–$105 fully loaded ($190K–$210K annual cost over ~2,000 hours). Adjusted for the share of paid time that is actual engineering work, the effective cost of a productive hour is often $160 or more. Use your own payroll data — the fully loaded multiplier on base salary is usually 1.25–1.4×.
What is a good ROI for developer experience investments?
Mature initiatives with real adoption commonly show 100–250% annual ROI; vendor-commissioned studies report up to ~430% over three years under favorable assumptions. A more robust target is payback inside 12–24 months with the conversion discounts stated. Be suspicious of any first-year claim above ~3×.
How do you convert developer time saved into dollars?
Multiply measured hours saved by the fully loaded hourly rate — then apply a conversion factor (50–70%) reflecting how much of that time actually becomes throughput, capacity avoidance, or cost reduction, and scale by measured adoption. Verify the conversion in delivery metrics within two quarters.
Should you measure the productivity of individual developers?
Measure to locate system constraints, not to rank people. Individual-level metrics like lines of code or commit counts are easily gamed and corrode trust; McKinsey, DORA, and SPACE all direct measurement at the system and team level first. ROI models never require individual rankings — they require team-level deltas.
Conclusion: buy back the 20% with a number finance trusts
Your engineers are losing roughly a fifth of their week to friction; the vendors selling fixes will all claim 10× returns. Developer productivity ROI, done honestly — fully loaded costs, four value streams, stated conversion and adoption discounts, a frozen baseline — is how you decide which fixes are real and defend the budget that buys them. If you want an independent baseline of where your engineering hours actually go and which productivity investment pays back first, start with our AI readiness assessment.
Find your highest-value path to agentic delivery.
Map your readiness, delivery constraints, and first 90-day opportunity with the Snowman Labs AI Readiness Diagnostic.