How to Measure AI Developer Productivity: A Field Guide
Learn how to measure AI developer productivity: DORA, SPACE, and DX Core 4 frameworks, metrics that survive AI, data collection, and a 6-step rollout.
 By Danilo BrizolaUpdated
 To measure AI developer productivity, you need three things no single dashboard provides: a frozen pre-AI baseline, a layered metric portfolio covering utilization, impact, and cost, and data collected from systems of record rather than self-report. Measured this way, honest numbers cluster far below the marketing: DX's research across 38,880 developers at 184 companies puts median AI-driven time savings around 3 hours 45 minutes per developer per week and real productivity gains at 5–15% — while METR's randomized controlled trial showed experienced developers can be 19% slower with AI while believing they are 20% faster.
This guide is for engineering leaders who need a measurement system, not a vibe. It covers what "productivity" even means once AI writes a large share of the code, how the established frameworks (DORA, SPACE, DevEx, DX Core 4) adapt, which metrics survive contact with AI and which become actively misleading, how to collect the data without turning measurement into surveillance, and a six-step implementation plan. For converting these measurements into dollars and a CFO-ready case, see the companion pillar on how to measure ROI from AI in software engineering — this article is about the measurement layer underneath that math.
Why measuring AI developer productivity is uniquely hard
The core problem is a documented gap between perceived and actual productivity. In METR's trial, sixteen experienced open-source developers completed 246 real tasks in mature codebases; the AI-assisted condition was 19% slower, yet participants estimated — even after finishing — that AI had sped them up by roughly 20%. A 39-percentage-point perception gap means the most common measurement approach in the industry, asking developers whether they feel faster, is not a measurement at all.
The second problem is that credible studies disagree because they measure different work. GitHub's controlled experiment found a 55% speedup on a well-scoped greenfield task; McKinsey's lab study found gains from ~50% on documentation down to under 10% on high-complexity work; METR found negative results for experts in million-line repositories. None of these numbers is your number. Codebase age, task mix, and engineer seniority swing the outcome from strongly positive to negative, which is why borrowing a benchmark is not an option — especially if a large share of your backlog lives in legacy systems, where measurement discipline matters even more because gains are real but concentrated in specific task types.
The third problem is systemic: the 2025 DORA report on AI-assisted development, drawing on nearly 5,000 survey responses, found that ~90% of developers now use AI at work, yet AI acts as an amplifier of the surrounding engineering system — individual speedups pool at the next bottleneck (usually code review) and can surface as instability rather than throughput. Measuring individuals in isolation therefore tells you almost nothing about whether the organization got faster.
What "developer productivity" means once AI writes the code
Under AI, productivity is the rate at which the system converts engineering effort into production outcomes at held or improved quality — not the rate at which individuals produce code. That redefinition has three concrete consequences for measurement:
- Activity metrics invert. Code volume, commit counts, and suggestion throughput become nearly free to inflate, so they stop discriminating between productive and unproductive teams. More code is now as likely to be a liability signal as a productivity signal.
- The bottleneck relocates. AI compresses authoring time, which moves the constraint to review, verification, and deployment. A measurement system that only watches authoring speed will report success while the review queue silently absorbs the gain.
- Quality becomes a co-equal axis, not a footnote. DORA's 2024 research associated rising AI adoption with a 7.2% decrease in delivery stability. Any productivity readout without paired quality counterweights (change failure rate, rework, defect escape) is structurally biased toward false positives.
The practical upshot: measure teams and delivery systems, use individual-level data only in anonymized aggregate, and never headline a speed number without its quality pair.
The frameworks: DORA, SPACE, DevEx, and DX Core 4 under AI
You do not need to invent a measurement philosophy — four established frameworks cover the territory, and they compose rather than compete. (This section reads them through the AI lens; for the general framework-selection guide and the full metrics portfolio, see our leader's guide to engineering productivity metrics.)
| Framework | What it measures | Strength for AI measurement | Limitation |
|---|---|---|---|
| DORA | Four delivery outcomes: deployment frequency, lead time, change failure rate, recovery time | Outcome-level, hard to inflate with AI activity; decade of benchmarks | Says nothing about where in the inner loop AI helps or hurts |
| SPACE | Five dimensions: Satisfaction, Performance, Activity, Communication, Efficiency/flow | Forces multi-dimensional reading; catches morale and flow effects telemetry misses | A menu, not a metric set — teams struggle to operationalize it |
| DevEx | Flow state, cognitive load, feedback loops (survey-based) | Explains why productivity moves; AI shifts cognitive load from writing to verifying | Self-reported; inherits the perception gap unless corroborated |
| DX Core 4 | Unified speed / effectiveness / quality / impact, encapsulating the other three | Designed as oppositional metrics — gaming one degrades another; field-tested across 300+ organizations | Requires survey infrastructure alongside telemetry |
For the AI layer specifically, the most useful operational structure is the three-dimensional AI Measurement Framework popularized by DX:
- Utilization — daily/weekly active users, share of PRs that are AI-assisted, tasks delegated to agents. Utilization is a precondition, never a result: DX finds even leading organizations plateau at 60–70% weekly active usage, and usage frequency strongly predicts gains (in one enterprise analysis, daily users shipped nearly 5x the PRs of non-users — a correlation that also reflects who opts in, which is why cohort baselines matter).
- Impact — time savings, throughput against baseline, quality trends, developer-experience scores.
- Cost — spend per developer, net time gain, agent inference costs. This dimension feeds the business case for AI in software engineering rather than the productivity readout itself.
The metric portfolio: what to track at each layer
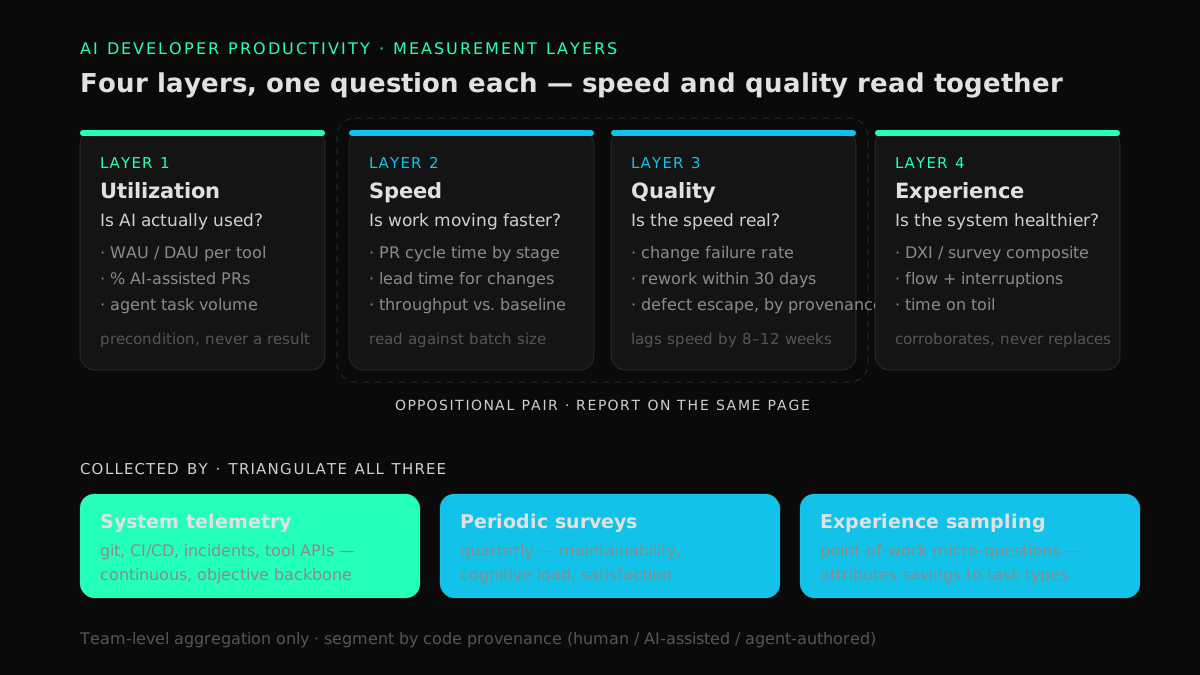
A workable AI developer productivity dashboard has four layers, each answering one question. Pull the definitions below into your instrumentation and resist adding more until these are trustworthy.
| Layer | Question | Core metrics | Guardrail |
|---|---|---|---|
| Utilization | Is AI actually being used? | WAU/DAU per tool, % of merged PRs AI-assisted, agent task volume | Never set usage as a target — mandated adoption produces trivial usage |
| Speed | Is work moving faster? | PR cycle time (authoring + pickup + review as stages), lead time for changes, same-team throughput vs. baseline | Read against batch size; smaller PRs shrink cycle time without adding value |
| Quality | Is the speed real? | Change failure rate, defect escape rate, rework/churn within 30 days of merge (segmented by AI provenance) | Quality lags speed by 8–12 weeks; do not declare victory early |
| Experience | Is the system healthier for humans? | Developer Experience Index or equivalent survey composite, flow/interruption measures, time on toil | Survey data corroborates telemetry, never replaces it |
Two design principles hold the portfolio together. First, segment by code provenance — human, AI-assisted, agent-authored — because aggregate numbers can look healthy while one cohort fails at twice the baseline rate; the instrumentation mechanics are covered in our guide to DORA metrics for AI-assisted software teams. Second, pair every speed metric with a quality counterweight on the same page. The DX Core 4's "oppositional metrics" design exists precisely because any single-axis readout under AI is gameable by accident.
Metrics that stop working under AI
Four metrics that were merely weak before AI become actively misleading after it:
- Lines of code and commit counts. Generation is nearly free, so volume now measures verbosity and future maintenance load. Treat unusual code-volume growth as a risk flag, not an achievement.
- Suggestion acceptance rate. Peer-reviewed analysis in Communications of the ACM found acceptance rate correlates with perceived productivity — the same perception METR showed can be inverted from reality. It is a vendor engagement metric; keep it out of leadership decks.
- Self-reported time savings as a headline. Useful for morale tracking, friction discovery, and adoption diagnostics; disqualified as a primary number by the 39-point perception gap. Corroborate it against telemetry or drop it.
- Individual productivity rankings. Beyond the ethics, individual dashboards corrupt the data: engineers optimize the measured number, teams stop reporting failures honestly, and the dataset degrades within a quarter. Aggregate at team level and publish the metric definitions to everyone measured.
Measuring agents, not just assistants
Autonomous coding agents (Cognition's Devin, Replit Agent, and similar) break two assumptions baked into every classic productivity framework: that one engineer works one task at a time, and that authoring cost is the scarce resource. Both DORA and SPACE still apply — but the unit of analysis shifts from the individual developer to the engineer-plus-agents delivery cell, and three agent-specific measures join the portfolio:
- Outcomes per delivery cell — merged production changes per senior engineer directing agent workstreams, against that engineer's pre-agent baseline.
- Human verification hours per agent outcome — the real scarce resource. If verification hours per merged agent PR trend upward as volume grows, the review queue is becoming the new bottleneck and gains are evaporating there.
- Agent cohort quality — change failure rate, rework, and incident attribution for agent-authored PRs versus the human baseline. A well-run agentic practice should see agent cohorts converge on human stability within a few quarters.
Verification is where measurement meets production reality: an agent PR that merges is not yet value, and review alone cannot predict how generated code behaves under real traffic. Runtime intelligence — the argument we develop in production-safe AI-generated code — is what lets a lean senior team supervise agent volume without the quality cohorts drifting. This distinction between measuring tool adoption and measuring a redesigned delivery system is the practical difference between agentic engineering and AI-assisted development.
How to collect the data: telemetry, surveys, experience sampling
Triangulate three collection methods; each covers the others' blind spots.
- System telemetry (git provider, CI/CD, incident management, AI tool admin APIs). Continuous, objective, and free of recall bias. This is the backbone — cycle times, throughput, quality cohorts, and utilization all come from here.
- Periodic surveys (quarterly). Capture what telemetry cannot: perceived code maintainability, cognitive load, satisfaction, where friction lives. DX's research finds each one-point improvement in its survey-based Developer Experience Index corresponds to about 13 minutes saved per developer per week — small per person, material across an organization.
- Experience sampling (point-of-work micro-questions, e.g., right after a PR merges: "did AI help on this task?"). Cheaper and far more accurate than retrospective estimates, and the best available tool for attributing time savings to specific task types.
One rule governs all three: measure to improve the system, and say so explicitly. The fastest way to destroy an AI measurement program is to let it read as performance surveillance — the data degrades before the trust does. And measurement is only the first half of the loop: once the baseline shows where AI is and isn't paying off, the follow-through lives in our guide to improving developer productivity with AI.
A six-step implementation plan
- Define the outcome unit and freeze a baseline. 60–90 days of pre-AI (or pre-expansion) telemetry: DORA four, PR cycle time by stage, quality indicators, survey scores. The baseline-first, same-engineer methodology — comparing teams against their own history rather than against other teams — is detailed in the pillar guide; the study-design options at the team level, and the confounders each controls, are compared in how to measure the impact of AI on software teams.
- Instrument provenance from day one. Label AI-assisted and agent-authored PRs at creation; retrofitting provenance is close to impossible.
- Stand up the survey layer before the rollout, so perception data has a baseline too.
- Pilot with 10–20% of engineering, matched on task type — the task-level evidence above means a platform team and a greenfield team are not comparable cohorts.
- Read leading indicators weekly, conclusions quarterly. Utilization and cycle time move in weeks; quality and experience need 8–12 weeks to mean anything. Expect a J-curve and message it in advance.
- Fold the readout into the operating cadence — monthly engineering review, quarterly re-baseline, and a standing decision rule for expanding or restricting AI scope per cohort. Sequencing this alongside enablement is the subject of our 90-day AI engineering enablement plan.
Expect the first month to be mostly instrumentation work. That cost is real, reusable, and small next to the spend it governs.
FAQ
Does AI actually increase developer productivity?
Usually, modestly, and unevenly. Cross-company research from DX puts honestly measured gains at 5–15% with median time savings around 3.75 hours per developer per week, while controlled studies range from a 55% speedup on well-scoped tasks (GitHub) to a 19% slowdown for experts in complex codebases (METR). The gain depends on task mix, codebase maturity, and the surrounding delivery system — which is why you measure your own teams against their own baseline.
What metrics should I use to measure AI developer productivity?
Use a layered portfolio: utilization (weekly active use, share of AI-assisted PRs), speed (PR cycle time by stage, lead time, throughput vs. baseline), quality (change failure rate, rework within 30 days, defect escape — segmented by AI provenance), and experience (a survey composite like the Developer Experience Index). Pair every speed metric with a quality counterweight, and aggregate at team level.
How much time do developers save with AI coding tools?
The best cross-company estimate is about 3 hours 45 minutes per developer per week (DX, across 38,880 developers), with heavy daily users saving substantially more than occasional users. Self-reported savings run higher than measured savings, so treat survey numbers as corroboration and let experience sampling plus telemetry produce the figure you report upward.
Is the SPACE framework still relevant for AI-assisted teams?
Yes — SPACE's core claim, that productivity is multi-dimensional and activity metrics alone mislead, is more true under AI, because activity is now nearly free to inflate. In practice most organizations operationalize SPACE through the DX Core 4, which folds SPACE, DORA, and DevEx into one measurable set spanning speed, effectiveness, quality, and impact.
Why is suggestion acceptance rate a bad productivity metric?
Because it measures engagement with the tool, not value delivered. Research published in Communications of the ACM found acceptance rate tracks perceived productivity — and METR's trial demonstrated perception can be inverted from measured reality. Developers also routinely accept suggestions and then rewrite them, inflating the metric further.
Should you measure individual developer productivity with AI?
Measure individuals only in anonymized, team-level aggregate. Individual dashboards and rankings corrupt the data (people optimize the number), destroy the trust the survey layer depends on, and misread the system — DORA's research shows individual speedups pool at shared bottlenecks like code review, so the individual lens misses where productivity actually goes.
How do you measure the productivity of autonomous coding agents?
Shift the unit from the developer to the engineer-plus-agents delivery cell: outcomes per cell against the engineer's pre-agent baseline, human verification hours per merged agent PR, and agent-cohort quality (change failure rate, rework, incident attribution) versus the human baseline. Cost per agent outcome is directly observable because agent work is metered.
Conclusion: build the measurement layer before the opinion layer
Measuring AI developer productivity comes down to four disciplines: a frozen baseline, a layered portfolio (utilization, speed, quality, experience) with oppositional pairs, provenance segmentation so AI's effect is isolated rather than inferred, and collection methods that triangulate telemetry with structured perception data. Organizations that do this boring work get something rare in the current market: the ability to say what changed, by how much, and where — and to expand or restrict AI scope per cohort instead of by anecdote.
If you want that measurement layer designed against your own delivery system, start with the AI Readiness Diagnostic — it baselines where your organization stands before AI amplifies it — or see how we instrument measurement inside delivery engagements on our AI software engineering ROI services page.
Find your highest-value path to agentic delivery.
Map your readiness, delivery constraints, and first 90-day opportunity with the Snowman Labs AI Readiness Diagnostic.