DORA Metrics for AI-Assisted Software Teams
How DORA metrics for AI-assisted development shift when assistants and agents write code — what to watch per metric, new counters, and a rollout plan.
 By Danilo BrizolaUpdated
 DORA metrics — deployment frequency, lead time for changes, change failure rate, and failed deployment recovery time — are still the most reliable way to measure software delivery performance, but AI-assisted development changes what each of them means. When assistants and coding agents enter the SDLC, the velocity metrics inflate first and the stability metrics degrade quietly, so DORA metrics for AI-assisted development need two upgrades: segmentation by code provenance (human, AI-assisted, agent-authored) and a small set of AI-specific counters around review latency, batch size, and rework. This guide shows engineering leaders exactly how the four keys behave under AI, which metric warns you first, and how to instrument all of it in six steps.
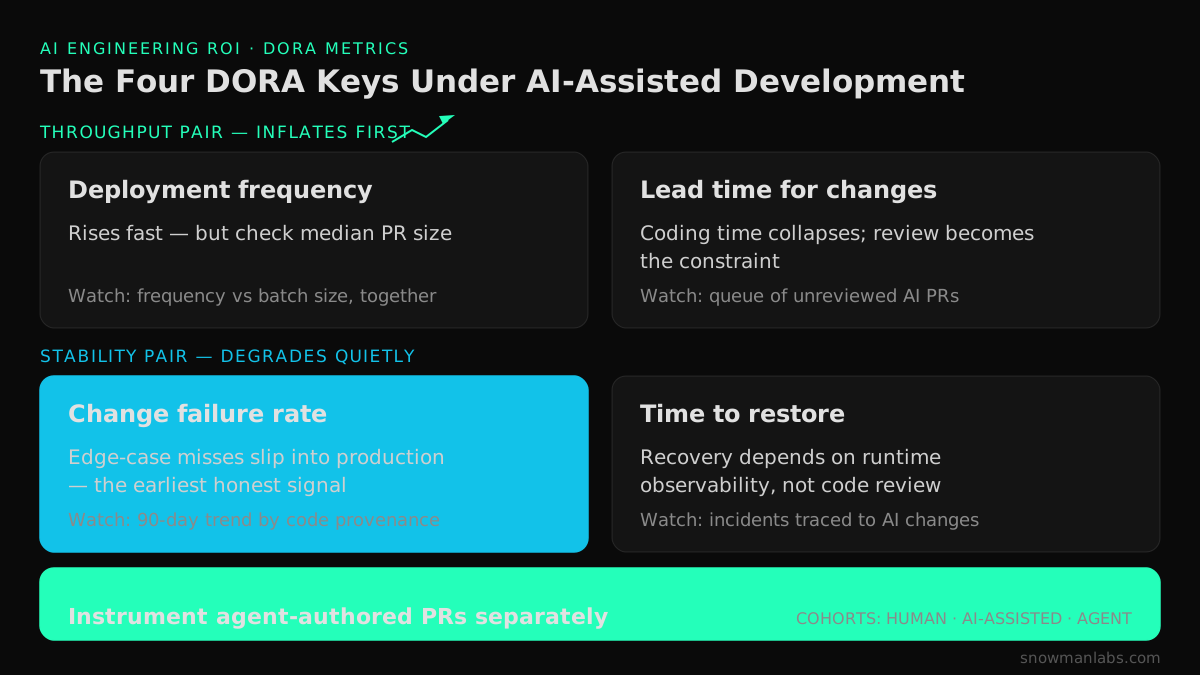
What DORA Metrics Measure — and What AI Changes
The four DORA keys, defined by the DORA research program over a decade of studying tens of thousands of teams, split into two pairs: throughput (deployment frequency, lead time for changes) and stability (change failure rate, failed deployment recovery time). The research's most durable finding is that elite teams are fast and stable — speed and quality are not a trade-off at the top. Elite performers deploy on demand, keep lead time under a day, hold change failure rate around 5%, and recover from failed deployments in under an hour.
AI-assisted development stresses exactly that balance. Coding assistants and autonomous agents push the throughput pair up almost immediately — GitHub's controlled experiment found developers completed a benchmark task 55% faster with Copilot — while the stability pair absorbs the risk weeks later. If you only watch the velocity metrics, AI adoption always looks like a win. If you watch all four as a system, you see what is actually happening: more code, bigger changes, faster merges, and — in teams without the right controls — more production failures per change.
That is why DORA metrics remain the right backbone for measuring AI's impact: they measure outcomes at the delivery level, not activity at the individual level, so they are hard to inflate with acceptance rates or lines of code. What changes is how you read, segment, and extend them. (For where DORA fits in the full business case, see our pillar guide on how to measure ROI from AI in software engineering.)
What the DORA Research Actually Says About AI
The DORA program has now studied AI's effect on delivery performance across multiple annual reports, and the findings are more sobering than vendor benchmarks suggest.
The 2024 Accelerate State of DevOps Report found that AI adoption was hurting delivery: a 25% increase in AI adoption was associated with an estimated 1.5% decrease in delivery throughput and a 7.2% decrease in delivery stability. Developers were individually faster, yet the delivery system as a whole shipped less reliably. DORA's explanation is consistent with its decade of prior data: AI makes it easy to produce more code per change, batch sizes grow, and larger changes have always carried more risk.
The 2025 State of AI-assisted Software Development report — built on a survey of nearly 5,000 technology professionals plus more than 100 hours of interviews — found that roughly 90% of developers now use AI at work and that the throughput picture had improved, but the negative relationship with stability persisted, and trust stayed low: roughly three in ten respondents said they trust AI-generated code only a little or not at all. The report's central conclusion is the one every measurement program should be built around: AI is an amplifier. It magnifies the strengths of teams with small batches, strong version control, fast feedback, and quality platforms — and the weaknesses of teams without them.
DORA operationalized that conclusion in its AI Capabilities Model, which identifies seven conditions that determine whether AI adoption improves or degrades delivery performance: a clear and communicated AI stance, a healthy data ecosystem, AI-accessible internal data, strong version control practices, working in small batches, a user-centric focus, and quality internal platforms. Notice that none of these is a tool choice. The measurement implication is direct: your DORA dashboard is measuring the quality of your engineering system under amplification, not the quality of your AI vendor.
The Four Keys Under AI: Metric by Metric
Here is how each key behaves when assistants and agents enter the workflow, and what to watch so the metric keeps telling you the truth.
| DORA key | What it measures | What AI changes | What to watch |
|---|---|---|---|
| Deployment frequency | How often code reaches production | Rises fast — more PRs, faster merges. Can rise for the wrong reasons if changes get bigger, not smaller | Frequency alongside median PR size; frequency up + batch size up = accumulating risk |
| Lead time for changes | Time from commit to production | Coding time collapses; review and validation become the constraint. Middle shrinks, edges expand | Review latency as its own stage; the queue of unreviewed AI-authored PRs |
| Change failure rate | Share of deployments causing production failure | Most disrupted metric. Plausible code that misses edge cases; AI-written tests share the same blind spots | CFR segmented by code provenance; 30/90-day trend after each expansion of AI usage |
| Failed deployment recovery time | Time to restore service after a failed deployment | Diagnosis is slower when no human holds the mental model of the change | Recovery time for incidents traced to AI-authored changes; runtime observability coverage |
Deployment frequency: up, but check why
Deployment frequency in AI-assisted teams almost always improves — that is the metric AI coding tools are built to move. The question is composition. If deploys per day doubled because the team ships smaller changes more often, that is genuine elite behavior. If deploys rose 30% while median PR size rose 50%, you have increased risk per unit of review attention, not improved delivery. Always read deployment frequency gains from AI coding against batch size — DORA's data is unambiguous that large changes fail more.
Lead time for changes: the bottleneck moves to review
AI compresses the implementation stage of lead time and exposes review as the new constraint. Industry telemetry consistently shows the same pattern: task completion and PR volume jump double-digit percentages while PR review time grows even faster, because human reviewers become the queue that absorbs the extra output. Track lead time as stages — coding, pickup, review, deploy — not as one number. A team whose total lead time is flat may still have cut coding time 60% and doubled review wait, which is a solvable process problem hiding inside a healthy-looking metric.
Change failure rate: where AI-generated code shows its cost
Change failure rate for AI-generated code is the metric most directly disrupted, for a structural reason: models generate code that handles the scenarios described in the prompt and misses the undescribed edge cases, integration behaviors, and legacy quirks — and tests generated alongside that code inherit the same blind spots, as practitioner analyses like DevOps.com's breakdown of DORA under AI have detailed. A second mechanism is human: reviewers extend more trust to confident, well-formatted output than it has earned, and approve faster. Both mechanisms push failures into production rather than catching them in the pipeline — which is exactly why CFR, not deployment frequency, is your early-warning metric.
Failed deployment recovery time: observability decides
When an agent-authored change fails in production, no engineer holds the mental model of why the code is shaped the way it is. Recovery time then depends almost entirely on what your telemetry can show you: which change shipped, what behavior diverged, what the blast radius is. Teams that invest in runtime observability before scaling AI usage keep recovery times flat; teams that bolt it on after their first bad quarter do not. This is the core argument of our deep dive on production-safe AI-generated code and runtime context — runtime intelligence platforms like Hud exist precisely because AI-authored code fails in ways that code review cannot predict but production telemetry can explain.
Why Change Failure Rate Is Your Early-Warning Metric
If you can only put one alert on your DORA dashboard during AI adoption, put it on change failure rate. The reasoning:
- Velocity metrics improve first and loudest. Deployment frequency and lead time respond within weeks and generate the internal success story. Nobody escalates good news.
- Stability failures lag and compound. Edge-case bugs from AI-generated changes surface over 30–90 days, and each one adds unplanned work that eats the velocity gain.
- CFR is the earliest honest signal. Recovery time only moves after failures accumulate; rework costs take a quarter to reach the financials. CFR moves the moment defective changes start reaching production.
A practical operating rule: baseline CFR before each expansion of AI usage, then watch the trend for 90 days. A modest, temporary rise is normal while review practices mature. A sustained rise — or one concentrated in AI-assisted changes once you segment by provenance — means throughput gains are being financed by stability debt, and the correct response is process (smaller batches, stronger review gates, better context for the model), not abandoning the tooling. DORA's 2024-to-2025 findings show teams do close this gap as their systems mature.
Instrument Agent-Authored Work Separately
An aggregate DORA dashboard answers "how is delivery performing?" It cannot answer "what is AI doing to delivery?" That requires segmentation by code provenance — which matters more as teams move from autocomplete-style assistance toward autonomous agents that own whole tasks (the difference we unpack in agentic engineering vs. AI-assisted development).
Track three cohorts:
- Human-authored changes — your baseline and control group.
- AI-assisted changes — a developer wrote the PR with assistant support (Copilot-style completion, chat-driven edits).
- Agent-authored changes — an agent such as Cognition's Devin or a Replit agent produced the PR end-to-end, with a human reviewing and merging.
Mechanically, this is cheap: label PRs at creation (agent integrations can label automatically; assistant usage comes from tool telemetry or a PR template checkbox), and compute the four keys per cohort. What it buys you is the ability to answer the questions your CFO and engineering directors will actually ask: Do agent-authored PRs fail more often than human ones? Is their review latency the bottleneck? Is their rework rate falling as guardrails and context infrastructure mature? In agentic engineering done well — senior engineers orchestrating parallel agents rather than typing every line — agent-authored cohorts should approach, then match, human stability metrics within a few quarters. If they don't, the cohort data tells you where to intervene.
Extending DORA: AI-Specific Counters Worth Adding
The four keys are necessary but not sufficient once agents write a meaningful share of your code. Add these counters — each exists to protect the interpretation of a DORA key, not to replace it:
| Counter | Definition | Why it matters |
|---|---|---|
| Agent PR ratio | Share of merged PRs that are agent-authored | Your AI exposure. All other metrics are read against it — a stable CFR while agent PR ratio triples is a strong system |
| CFR by provenance | Change failure rate per cohort (human / AI-assisted / agent) | Locates stability risk precisely instead of blaming "AI" in aggregate |
| Rework rate | Share of merged code significantly modified within 30 days | Catches the quiet failures CFR misses — code that "worked" but had to be rewritten |
| Review latency | Time from PR opened to first review, and to merge, per cohort | The new lead-time bottleneck; rising latency means output is outrunning review capacity |
| Batch size | Median PR size (lines or files changed) | DORA's oldest risk predictor; AI inflates it by default |
| Incident traceability | Share of production incidents attributable to a specific change and cohort | Without it, recovery time degrades and cohort CFR is unmeasurable |
Rework rate deserves emphasis because it pairs with change failure rate the way a smoke detector pairs with a fire alarm: CFR counts the deployments that visibly failed; rework rate counts the merges that quietly didn't hold. A healthy CFR with a climbing rework rate means small problems are slipping through review and being fixed under other ticket numbers — a pattern engineering-intelligence vendors (LinearB, Swarmia, Faros, DX) now surface precisely because pure DORA dashboards structurally miss it.
How to Implement DORA Metrics for AI-Assisted Teams
A rollout that produces decision-grade numbers, not dashboard decoration:
- Baseline before you scale AI. Capture at least 90 days of the four keys before expanding assistant or agent usage. Without a pre-AI baseline, every later argument about impact is opinion.
- Fix your definitions in writing. What counts as a deployment, as production, and — critically — as a failure (rollback, hotfix, feature-flag kill, sev-2 or worse). Loose failure definitions are how CFR gets gamed.
- Automate collection from the delivery pipeline. Deployment events from CI/CD, failures from incident management, lead time from commit and deploy timestamps. Surveys supplement but never replace pipeline telemetry.
- Tag code provenance at the source. Label agent-authored PRs automatically via the agent integration; capture assistant usage from tool telemetry. Retrofitting provenance later is close to impossible.
- Segment dashboards by cohort and set guardrail thresholds. For example: alert when a cohort's CFR runs materially above the human baseline for 30 days, when median PR size exceeds its ceiling, or when review latency breaches its SLO.
- Review monthly and feed the ROI model. Cohort-level DORA trends become the delivery-performance input to your business case — cost per change, capacity gained, incident cost avoided. Metrics that never reach a budget conversation don't survive one.
Expect the instrumentation to consume real effort in the first month and almost none after that. If you are sequencing a broader rollout, this measurement layer is the first-two-weeks workstream in our 90-day AI engineering enablement plan — it must exist before the tools scale, for the baseline reason above.
Keeping the Metrics Honest: Anti-Gaming Guidance
Every metric that influences decisions invites optimization of the metric instead of the outcome — and AI makes several DORA keys easier to game than ever. Guardrails that hold up in practice:
- Never use DORA metrics for individual performance evaluation. The four keys are team- and system-level outcomes. The moment deploy counts touch a performance review, you get deployment-splitting, and the metric dies.
- Always read the pairs together. Deployment frequency without CFR rewards shipping garbage fast. CFR without deployment frequency rewards shipping nothing. Report them as one system, on one page.
- Define failure broadly and audit it. Teams under pressure reclassify rollbacks as "planned changes" and hotfixes as "fast follows." Spot-check incident-to-deployment mapping quarterly.
- Watch batch size as the integrity check. Rising deployment frequency with rising PR size means the frequency gain is cosmetic. Small batches are simultaneously DORA's top risk reducer and the best anti-gaming control.
- Don't turn agent PR ratio into a target. It is an exposure measure, not an achievement. Mandating "X% of PRs from agents" produces trivial agent PRs; let the stability cohorts tell you when to expand agent scope.
- Publish the metric definitions to everyone measured. Gaming thrives in ambiguity; a one-page definitions doc, versioned in the repo, removes most of it.
FAQ
What are the four DORA metrics?
The four DORA metrics are deployment frequency, lead time for changes, change failure rate, and failed deployment recovery time (formerly MTTR). The first two measure throughput, the last two measure stability, and DORA's research shows elite teams excel at both simultaneously.
Are DORA metrics still relevant for AI-assisted development?
Yes — arguably more relevant, because they measure delivery outcomes rather than coding activity, which makes them resistant to the inflated productivity signals AI tools generate (acceptance rates, lines of code, PR counts). What changes is the reading: velocity gains must be validated against stability, and metrics should be segmented by code provenance to isolate AI's actual effect.
How does AI affect DORA metrics?
AI typically raises deployment frequency and shortens coding time quickly while increasing stability risk. DORA's 2024 report associated a 25% increase in AI adoption with an estimated 7.2% decrease in delivery stability; the 2025 report found throughput improving, with stability still the pressure point. The main mechanisms are larger batch sizes, overloaded review queues, and plausible code that misses edge cases.
What is a good change failure rate?
DORA benchmarks put elite performers around 5%, with strong teams generally under 15%. For AI-assisted teams the segmented trend matters more than the absolute number: compare CFR for AI-assisted and agent-authored changes against your human baseline, and treat a sustained gap as a signal to tighten batch sizes, review gates, and model context.
Should AI-generated code be measured separately from human-written code?
Yes. Tag PRs by provenance — human, AI-assisted, agent-authored — and compute DORA metrics per cohort. Aggregate numbers can show a healthy average while agent-authored changes fail at twice the baseline rate, and cohort data is the only credible evidence base for expanding or restricting agent scope.
How do you measure AI developer productivity beyond DORA?
Pair DORA's delivery outcomes with utilization (who actually uses the tools), impact (time savings, rework, quality trends), and cost (spend against capacity gained) — the structure recommended by DORA's own ROI of AI-assisted development research. Our field guide to measuring AI developer productivity covers that full metric portfolio, including surveys and experience sampling; converting it into dollars requires the model in our pillar guide to measuring AI engineering ROI.
Why did DORA find that AI adoption hurt software delivery performance?
The 2024 finding — throughput down an estimated 1.5%, stability down 7.2% as AI adoption rose 25% — traces mostly to batch size: AI makes it easy to write more code per change, and larger changes have always failed more. The 2025 report reframed the conclusion: AI amplifies the existing engineering system, so organizations with small batches and strong platforms gain, while the rest amplify their weaknesses.
Conclusion: Measure the System, Not the Hype
DORA metrics for AI-assisted development work when you treat them as a system: velocity and stability read together, segmented by code provenance, extended with a handful of counters — agent PR ratio, rework rate, review latency, batch size — that protect their interpretation. The research is consistent: AI amplifies the engineering system it lands in. The four keys are how you find out, early and quantitatively, what yours is amplifying — and change failure rate is the metric that warns you first.
If you are building this measurement layer while rolling out assistants or agents, Snowman Labs runs this exact model — senior engineering teams orchestrating parallel agents on platforms like Cognition's Devin and Replit, with Hud providing the runtime context that keeps recovery times flat — and instruments engagements with the cohort-level DORA baseline described here. See how we tie delivery metrics to the financial case on our AI software engineering ROI services page, or start with the free AI Readiness Diagnostic to baseline where your delivery system stands before AI amplifies it.
Find your highest-value path to agentic delivery.
Map your readiness, delivery constraints, and first 90-day opportunity with the Snowman Labs AI Readiness Diagnostic.