AI Adoption for Engineering Teams: From Licenses to Lift
Why AI adoption for engineering teams stalls after the license purchase — five stall patterns, an adoption ladder, six levers, and metrics that don't lie.
 By Danilo Brizola
AI adoption for engineering teams is the distance between a purchased license and an engineer who reaches for the tool on real work, every week, inside governed workflows — and most organizations are stuck somewhere in the middle of that distance. The 2025 DORA report puts AI usage at 90% of software professionals, yet roughly 30% report little or no trust in AI-generated code, and enterprise telemetry consistently shows weekly active usage running far below license coverage. This guide is for CIOs, CTOs, and VPs of Engineering whose rollout has stalled — or who want to keep it from stalling. It covers why adoption stalls in engineering specifically, the ladder from autocomplete to agents, the six levers that actually move usage, and how to measure adoption without fooling yourself.
One framing note up front: adoption is the denominator of your AI business case. Every dollar of the program is spread across the engineers who actually use the tools, so a 30%-adopted rollout pays roughly triple the effective cost per active user of a 90%-adopted one. That is why adoption belongs inside the same measurement discipline as ROI of AI in software engineering — not in a separate "change management" bucket that never meets the numbers.
The Adoption Gap: Access Is Not Adoption
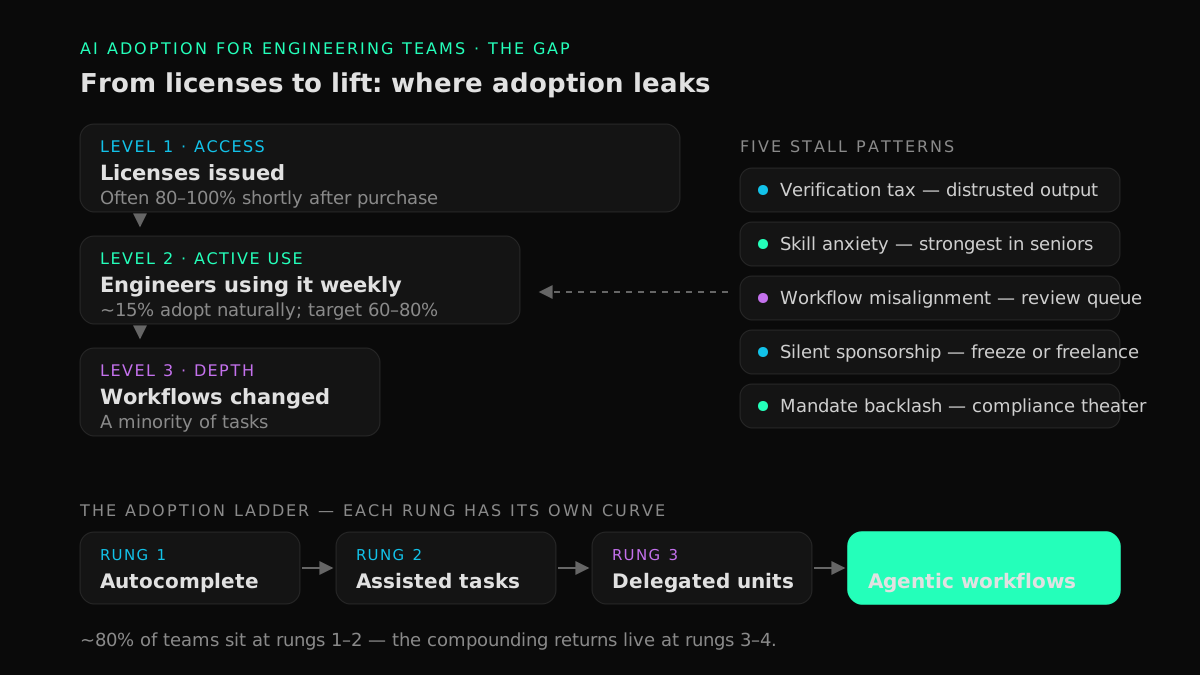
Access, active use, and workflow depth are three different numbers, and rollouts fail quietly in the gaps between them. License coverage tells you what procurement did. Weekly active usage tells you what engineers do. Workflow depth — the share of real delivery work where AI participates — tells you whether anything about your delivery system has actually changed.
| Level | What it measures | Typical enterprise reality | Where it's visible |
|---|---|---|---|
| Access | Licenses issued / engineers | Often 80–100% shortly after purchase | Procurement records |
| Active use | Engineers using the tool weekly | Frequently a fraction of access; only ~15% of developers embrace new tools naturally, per Faros AI's enterprise telemetry analysis | Tool telemetry, IDE/agent logs |
| Workflow depth | Share of merged work with meaningful AI involvement | Concentrated in a minority of tasks and engineers | Tagged PRs, segmented delivery metrics |
The industry-level surveys measure the top of this funnel, which is why they look so healthy. The Stack Overflow 2025 Developer Survey found 84% of developers using or planning to use AI tools — and, in the same survey, 46% actively distrusting the accuracy of AI output. Cortex's framework for measuring effective AI adoption reports the bottom of the funnel: while 90% of engineering leaders report active AI tool usage, only 32% have formal governance policies in place, and 58% describe their confidence that AI is improving anything as "somewhat confident but mostly anecdotal."
That is the adoption gap: near-universal access, contested trust, thin governance, and impact nobody can prove. Closing it is an organizational problem, not a procurement problem.
Why AI Adoption Stalls: Five Patterns
Engineering teams are not a generic change-management audience. They evaluate tools hands-on, they have strong professional identities attached to their craft, and their work runs through a shared pipeline where one person's speed-up becomes another person's queue. Five stall patterns follow from that.
1. The verification tax
Engineers who distrust AI output — 46% in Stack Overflow's survey, ~30% in DORA's — don't necessarily stop using the tools. They re-verify everything, which converts promised time savings into review effort. When verification costs more than the generation saved, engineers rationally conclude the tool isn't worth it for their work, and usage decays to trivial tasks. The fix is not exhortation; it is constraining where AI output needs heavy verification (tests, guardrails, scoped task types) so the tax drops. Our guide to production-safe AI-generated code covers that machinery.
2. Skill-relevance anxiety — concentrated in your best people
In a 2026 Augment Code survey of engineering leaders, 63% reported engineers voicing concerns about skill relevance — rising to 89% at organizations with 201–1,000 engineers. The anxiety concentrates among senior engineers, who have the most identity invested in craft and the most influence over everyone else's behavior. A rollout framed, even implicitly, as headcount replacement will be quietly killed by exactly the people whose endorsement it needs.
3. Workflow misalignment
AI tools that generate code faster than the organization can review, test, and release it don't accelerate delivery — they relocate the queue. More pull requests, larger diffs, and review comments like "why did it choose this pattern?" raise the cognitive load on reviewers, who are usually the same senior engineers from pattern 2. If the tool doesn't fit how code actually moves from keyboard to production, engineers experience adoption as added coordination work, and drop it. This is the individual-versus-system gap in miniature; the levers for converting individual assistance into delivery gains are covered in improving developer productivity with AI.
4. Silent sponsorship
BCG's AI at Work 2026 survey (as reported in Augment Code's guide) found 74% frontline AI use but only 33% of respondents saying leadership communicates clearly about AI. Engineers in that gap are left to guess what is allowed, what is encouraged, and what happens to people whose roles change. DORA's 2025 research names a clear, communicated AI stance as one of the seven capabilities that amplify AI's benefits — and its absence produces the two failure modes every enterprise recognizes: engineers who freeze (use nothing, wait for policy) and engineers who freelance (use unapproved tools on company code).
5. Mandate backlash
Top-down usage mandates produce compliance theater: the tool gets opened, metrics tick up, and nothing changes in how work is done. Faros AI's analysis of senior-engineer adoption found peer-champion-driven approaches 22% more effective than top-down mandates — senior engineers accept "this made my colleague faster on work like mine" as evidence and discount executive enthusiasm entirely. Hype has the same backfire: every overpromise ("agents will ship features autonomously by Q3") converts a neutral engineer into a skeptic when reality arrives.
The Adoption Ladder: From Autocomplete to Agents
"Adoption" is also not one thing. An organization can be fully adopted at one rung of capability and not have started the next. Most are: Coder's 2026 survey of engineering organizations found nearly 80% still at the first two stages — code completion and human-directed local agents — despite 92% of developers using AI in some form.
| Rung | What the engineer does | What the organization must supply |
|---|---|---|
| 1. Autocomplete | Accepts inline suggestions while typing | Licenses, basic data-handling policy |
| 2. Assisted tasks | Prompts for functions, tests, explanations in the IDE | Prompt patterns, usage guidelines, training |
| 3. Delegated units | Hands an agent a scoped ticket; reviews the result | Task-routing judgment, review capacity, CI guardrails |
| 4. Agentic workflows | Directs multiple agents across the backlog; verification is the job | Governance gates, runtime feedback, redesigned roles |
Two things about the ladder matter for adoption strategy. First, each rung has its own adoption curve — conquering rung 1 tells you little about rung 3, because delegation changes what engineers do all day rather than speeding up what they already did. Second, the payoff distribution is not linear: autocomplete gains are real but bounded, while the step-change lives at rungs 3–4, where engineers direct agents through meaningful units of work — the operating model we call agentic engineering. A rollout plan that treats "we deployed autocomplete" as finished has adopted the cheapest rung and left the return on the table.
Readiness: What the Amplifier Finding Means for Rollout Order
The 2025 DORA report's central finding is that AI is an amplifier: it magnifies the strengths of well-run organizations and the dysfunctions of struggling ones. For adoption strategy, that converts into a sequencing rule — the practices that make AI safe to adopt must exist before usage scales, or adoption itself creates the evidence that kills the program (instability, incidents, review chaos).
Minimum readiness checklist before pushing adoption past the pilot stage:
- Version control and small-batch discipline — AI-scale code volume through big-batch processes multiplies risk.
- A test safety net on the codepaths where AI will work — this is what shrinks the verification tax (stall pattern 1).
- Fast feedback loops — CI that returns verdicts in minutes, so agent output is checked by machinery rather than patience.
- A written, communicated AI stance — approved tools, prohibited data, mandatory review rules (stall pattern 4).
- Baseline metrics captured before scaling — you cannot demonstrate adoption's value later without the "before" picture; instrumenting the four keys so AI-attributed work can be segmented is covered in DORA metrics for AI-assisted teams.
If several boxes are unchecked, fixing them is the adoption program's first phase — not a delay to it.
Six Levers That Actually Move Adoption
These are the interventions with evidence behind them. (If what you need is the full day-by-day rollout program — baseline, pilot squads, governance gates, exit criteria — that is a separate artifact, and we've published ours: the 90-day AI engineering enablement plan. This section is about the adoption dynamics that make any such plan work.)
- Sponsorship that talks. Close the 74/33 communication gap personally: what's allowed, what's encouraged, what the organization believes about roles. One clear memo from the CTO outperforms a portal of policy PDFs.
- Champions over mandates. Recruit respected senior engineers — including converted skeptics, who are worth five enthusiasts — and give them time to demonstrate real use cases on real work. This is the 22%-more-effective lever, and it directly targets stall pattern 2.
- Workflow redesign, not tool insertion. Pick two or three specific workflows (bug triage, test authoring, migration chores), redesign them around AI participation, and make them boringly repeatable. Generic "use AI more" enablement diffuses; workflow-specific enablement compounds.
- Shared learning loops. Prompt libraries, internal pattern collections, a standing agenda item for "what worked / what didn't." This turns individual discoveries into organizational assets and normalizes honest failure reports — which protect trust better than success stories.
- Friction removal as a standing activity. Instrument where usage drops off (login walls, context limits, slow environments, unclear policy) and fix the top item every sprint. Adoption follows the path of least resistance; make the sanctioned path the easy one.
- Honest messaging about limits. Tell engineers what the tools are bad at, publicly. Credibility on limitations is what makes claims about strengths believable — and it is the only durable antidote to the hype backlash.
Measuring Adoption Without Fooling Yourself
Measure adoption in three families, and never let the first stand alone:
- Coverage: weekly active users ÷ licensed users. Faros AI's enterprise benchmarks suggest targeting roughly 80% monthly and 60% daily active usage within six months of rollout.
- Depth: share of AI-assisted pull requests, distribution of usage across engineers and task types (is it three enthusiasts or the whole team?), rung on the adoption ladder.
- Outcome guardrails: the delivery and quality metrics that tell you whether adoption is worth anything — cycle time, change failure rate, escaped defects, cost per delivered outcome, all against a frozen baseline.
Two warnings from the measurement literature. First, do not accept self-reported adoption success as evidence: in METR's 2025 randomized controlled trial, experienced developers estimated AI had made them 20% faster on tasks where it had measurably made them 19% slower — a 39-point perception gap that survives even hindsight. Surveys diagnose friction and morale; telemetry and delivery metrics carry the conclusions. Second, pick the reporting altitude deliberately: adoption percentages are a useful operating metric and a terrible board metric, because 100% adoption proves nothing about value by itself. Which metrics belong at which level is the subject of our AI productivity metrics scorecard for engineering leaders.
When Adoption Is High and Results Are Not
High usage with flat or negative results is common enough to have a data signature. Cortex's aggregate telemetry shows the pattern: pull requests per author up 20%, incidents per PR up 23.5%, change failure rates up 30% in the cohorts that adopted fastest without guardrails. This is the amplifier working as described — more throughput into a system that couldn't absorb it.
When you see this signature, the diagnosis is almost never "the tool doesn't work" and almost always one of three things: a displaced bottleneck (usually review capacity), missing quality machinery on the newly AI-heavy codepaths, or usage concentrated on the wrong task types. Segmenting AI-assisted versus non-assisted work and running honest before/after comparisons is its own methodological discipline — cohorts, confounders, J-curve timing — covered in how to measure the impact of AI on software teams. And when the numbers are in, the conversion from delivery deltas to dollars runs through the framework in our ROI measurement pillar.
Adoption, in other words, is necessary and not sufficient. It is the precondition for every benefit and the guarantee of none of them.
FAQ
What percentage of engineering teams use AI tools?
Usage is near-universal at the individual level: the 2025 DORA report found 90% of software professionals using AI at work, and JetBrains' 2026 survey similarly found 90% using at least one AI tool regularly. Organizational adoption is much thinner — most teams remain at the autocomplete and assisted-task rungs, and under a third have formal governance policies.
Why do senior engineers resist AI coding tools?
Three rational reasons, not technophobia: the verification tax (distrusted output must be re-checked, erasing savings on work they were already fast at), skill-relevance anxiety (63% of engineering leaders report it), and evidence standards — senior engineers discount vendor claims and executive enthusiasm, and update on peer demonstrations. That is why champion-driven rollouts measurably outperform mandates.
How do you measure AI adoption in an engineering team?
Use three families: coverage (weekly active users ÷ licenses), depth (share of AI-assisted PRs and the usage distribution across engineers and task types), and outcome guardrails (cycle time, change failure rate, cost per outcome against baseline). Never rely on self-reported time savings — METR measured a 39-point gap between perceived and actual speed-up.
What is a good AI adoption rate for developers?
Faros AI's enterprise benchmarks suggest roughly 80% monthly and 60% daily active usage within six months of a governed rollout. Below ~40% weekly active use, license spend is likely outrunning value; near 100% with flat delivery metrics usually signals compliance theater or a displaced bottleneck rather than success.
Does AI adoption actually make engineering teams faster?
The honest answer is: it depends on the system around it, and the credible evidence points both ways — a GitHub/Microsoft controlled experiment measured a 55.8% speed-up on a scoped task, while METR's RCT found experienced developers 19% slower in mature codebases they knew well. Organizations with strong testing, feedback loops, and review capacity convert adoption into delivery gains; others convert it into review queues and instability.
Should AI tool usage be mandatory for engineers?
Mandating access, governance, and training is reasonable; mandating usage is counterproductive. Mandates produce compliance theater and trigger backlash in exactly the senior population whose endorsement drives everyone else. Set the expectation that engineers seriously evaluate the tools on real work, instrument actual usage, and let champions and evidence do the persuasion.
From Adoption to Advantage
The adoption gap — between licenses bought and workflows changed — is where most enterprise AI programs currently sit, and it closes from the organization side, not the tool side: readiness before scale, champions before mandates, workflow redesign before enablement theater, and telemetry before anecdotes. Teams that close it earn the right to climb the ladder toward agentic workflows, where the compounding returns live.
If you want an outside read on where your organization actually stands — adoption levels, readiness gaps, and the highest-leverage next rung — that is precisely what our AI readiness assessment produces. And if the gap is enablement itself, our AI engineering enablement practice trains enterprise engineering teams in these exact mechanics — work we also do jointly with Cognition's Forward Deployed Engineers as an official Cognition enablement partner.
Find your highest-value path to agentic delivery.
Map your readiness, delivery constraints, and first 90-day opportunity with the Snowman Labs AI Readiness Diagnostic.